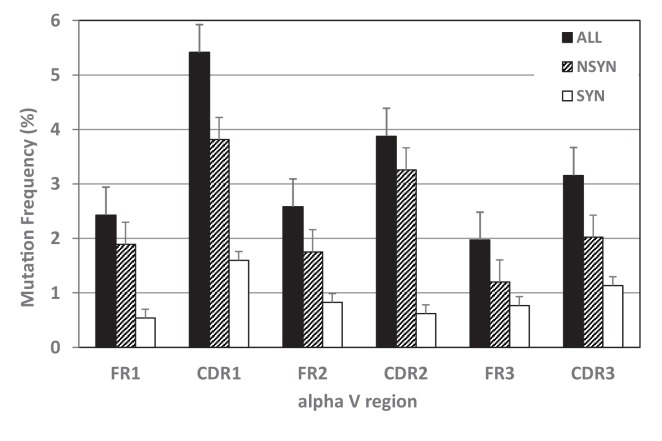
Figure 6. Mutation frequencies differed within TcR V regions.
Mutability of complementarity determining regions (CDR), especially CDR1, exceeded that of framework regions (FR) for all mutations together (black bars) and for nonsynonymous mutations alone (NSYN, hatched bars). We found no statistical difference in synonymous mutations (SYN, white bars) between CDRs and FRs.

