Abstract
Objective
To investigate changes in emergency department (ED) transfers for ischemic stroke (IS) and TIA.
Methods
We performed a retrospective observational study using the US Nationwide Emergency Department Sample to identify changes in interfacility ED transfers for IS and TIA from the perspective of the transferring ED (2006–2014). We calculated nationwide transfer rates and individual ED transfer rates for IS/TIA by diagnosis and hospital characteristics. Hospital-level fractional logistic regression examined changes in transfer rates over time.
Results
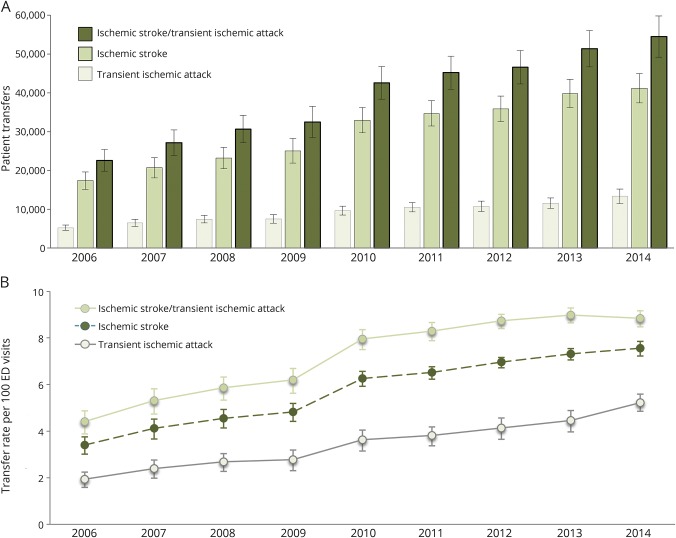
The population-estimated number of transfers for IS/TIA increased from 22,576 patient visits in 2006 to 54,485 patient visits in 2014 (p trend < 0.001). The rate of IS/TIA transfer increased from 3.4 (95% confidence interval [CI] 3.0–3.8) in 2006 to 7.6 (95% CI 7.2–7.9) in 2014 per 100 ED visits. Among individual EDs, mean transfer rates for IS/TIA increased from 8.2 per 100 ED visits (median 2.0, interquartile range [IQR] 0–10.2) to 19.4 per 100 ED visits (median 8.1, IQR 1.1–33.3) (2006–2014) (p trend < 0.001). Transfers were more common among IS. Transfer rates were greatest among rural (adjusted odds ratio [AOR] 3.05, 95% CI 2.56–3.64) vs urban/teaching and low-volume EDs (AOR 7.49, 95% CI 6.58–8.53, 1st vs 4th quartile). The adjusted odds of transfer for IS/TIA increased threefold (2006–2014).
Conclusions
Interfacility ED transfers for IS/TIA more than doubled from 2006 to 2014. Further work should determine the necessity of IS/TIA transfers and seek to optimize the US stroke care system.
Innovations in time-sensitive treatments for stroke have shaped regionalization of stroke care. Telestroke for the remote supervision of tissue plasminogen activator (tPA) administration prior to interfacility transfer is increasingly accepted across the United States to deliver necessary interventions and improve access to specialized neurologic care.1,2 Recent estimates demonstrate that interfacility transfers receiving thrombolytics account for a substantial proportion of stroke patients arriving to primary and comprehensive stroke centers.3 Even early urgent treatment of TIA has improved stroke prevention.4 Given the high costs associated with transferring a patient from one hospital to another,5 striking a balance between cost and need is essential. Understanding factors associated with interhospital transfer among patients with ischemic cerebrovascular disease is needed to build a stroke care system that can economically deliver care, optimize outcomes, and minimize unnecessary costs.6 Despite focus on regionalization of US stroke care over the last decade,7 there have been few nationally descriptive or quantitative studies of stroke and TIA interhospital transfers.3 We hypothesize a substantial increase in transfers for ischemic cerebrovascular disease nationwide in the recent past and sought to investigate temporal changes in transfers using nationwide data from 2006 to 2014.
Methods
Data source
We analyzed data from the Nationwide Emergency Department Sample (NEDS) of the Agency for Healthcare Research and Quality, Healthcare Cost and Utilization Project (HCUP), January 2006–December 2014 (all available years of the dataset). The NEDS is a nationally representative all-payer database of US emergency departments (ED), containing information from 30 million ED visits from 30 states and nearly 950 hospitals annually that approximates a 20% stratified sample of US hospital-based EDs.8 The universe of hospital-based EDs is therefore defined as all nonfederal, short-term, general, and other specialty hospitals including public hospitals and academic medical centers. The NEDS includes sociodemographic, diagnostic, procedural, and other resource use information. For visits resulting in admission, the dataset connects to an inpatient supplemental file containing inpatient resource utilization information.
HCUP data are de-identified, and therefore, the analysis is exempt from federal regulations for the protection of human research participants, and institutional review board approval was not necessary. The analysis is in compliance with HCUP data use agreement.
Encounter selection
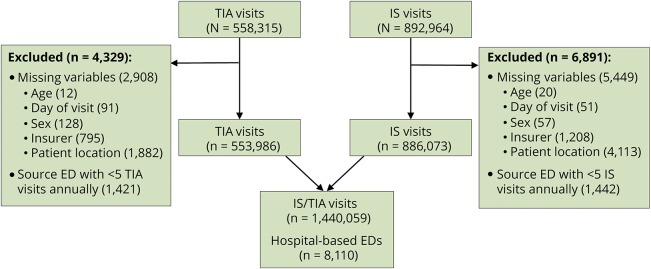
To identify adults (age ≥18 years) with the diagnosis of ischemic stroke (IS) or TIA we used ICD-9 codes 433.X1, 434.X1, and 436 for IS and 435 for TIA. We used codes within the first diagnostic field of the dataset. Per ambulatory ICD-9 guidelines, the first-listed code is for the “diagnosis, condition, problem or other reason for the encounter/visit shown in the medical record to be chiefly responsible for the services provided.” Those with missing key variables were excluded. We selected only EDs with at least 5 IS or TIA visits annually, allowing for the calculation of individual ED transfer rates (figure 1).
Figure 1. Emergency department (ED) visit selection.
IS = ischemic stroke.
Outcome measures
Acute care transfers were identified based on disposition to another short-term hospital from the transferring ED. We calculated both nationwide transfer rates and individual ED rates. Transfer rate was defined as the total number of transfers divided by the total number of ED visits including transfers, admissions, and discharges. IS and TIA transfer rates were analyzed separately and combined (denoted IS/TIA). For unique EDs that were randomly sampled in both the first and last year of the study, we examined changes in these individual ED transfer rates over time.
Since there were no individual patient identifiers within the dataset, transfers could only be identified as such at the transferring site (not the receiving site) within this dataset. There was no demarcation of patients received from another facility. Therefore, when estimating nationwide transfer rates (pooling all US ED visits) there is a risk of double-counting interfacility transfers—once as a transfer within the sending ED and a second time as an admission or discharge within the receiving ED. To mitigate the effects of this potential double-counting, the majority of the analysis was performed at the ED level. For nationwide transfer rates, we used an adjustment calculation to correct for double-counting by subtracting the number of estimated transfers from the rate denominator, similar to methods used previously for hospital administrative datasets.9 In sensitivity analyses, rates were analyzed (1) without a correction for double-counting and (2) with age standardization using direct standardization methods to account for the aging US population.10
Patient and hospital characteristics
Up to 15 diagnosis and 9 procedural fields were available in the NEDS. We identified comorbidities based on secondary diagnosis codes and calculated a Charlson comorbidity index tailored for stroke outcomes studies.11 Age, sex, insurance payer, and location of patient's residence were available in the database. Use of IV thrombolysis was determined using ICD-9 procedural code 99.10,12 which may underestimate thrombolytic administration for stroke.13,14
EDs could be individually identified from year to year using a unique HCUP NEDS hospital number. In addition to hospital characteristics included in the NEDS, such as urban/rural location and teaching/nonteaching status, we calculated annual patient volume for IS/TIA. We categorized hospital-level variables into quartiles for the analysis. We also classified EDs as low-income serving (i.e., >75% of patients from low-income areas based on median census income for county of patient residence) or Medicare-serving (i.e., >75% of patients insured by Medicare). We additionally identified hospitals with the availability of neurosurgical procedures, defined as the performance of at least one of the following within any of the inpatient procedural codes for admitted IS/TIA patients: carotid revascularization (ICD-9 code 00.63, 38.12), cerebral angiography (ICD-9 code 88.41), decompressive craniectomy (ICD-9 code 01.23, 01.24, 01.25, 02.01, 01.2), mechanical thrombectomy (ICD-9 code 39.74), or ventriculostomy or intracranial pressure monitoring (ICD-9 code 01.10, 01.18, 02.2, 02.21, 02.22, 02.39).
Statistical analysis
Descriptive statistics were used to characterize the changing number and proportion of IS/TIA patients transferred nationwide. HCUP sampling weights and strata were used to obtain nationwide estimates of transferred patients over time. Due to the risk of double-counting transferred patients in the ED of both sending and receiving hospitals when examining nationwide estimations, the primary analysis was performed with the ED as the unit of analysis and individual ED transfer rate as the outcome. Temporal changes were evaluated descriptively, and analyzed over time using a linear test for trends. Differences in transfer rates across categorical and continuous variables were assessed using Student t test, Wilcoxon rank-sum, or χ2 test where appropriate. We used a fractional logistic multivariable model to evaluate the effects of hospital characteristics and changes in hospital-based ED transfer rates over time. A fractional logistic regression has the benefit of capturing associations when the outcome variable ranges between 0 and 1 (e.g., transfer rate). Hypothesis tests were 2-sided using a 5% significance level with 95% confidence intervals (CIs). Analyses were conducted using STATA version 14.1 (College Station, TX).
Results
Changes in nationwide transfers
We identified 1,440,059 unweighted IS/TIA patient visits (62% IS, 38% TIA) from 2006 to 2014. The population-estimated (weighted) number of transfers for IS/TIA increased from 22,576 patient visits in 2006 to 54,485 patient visits in 2014 (linear test of trends, p < 0.001) (figure 2A). Approximately 76% of IS/TIA transfers were for IS. The estimated nationwide transfer rates per 100 ED visits for IS/TIA increased from 3.4 (95% CI 3.0–3.8) in 2006 to 7.6 (95% CI 7.2–7.9) in 2014 (figure 2B). Increases in nationwide transfer rates were similar for IS and TIA when analyzed separately, although increases in transfer rates for IS appear to slow after 2011 (figure 2B). From 2006 to 2014, the number of IS and TIA transfers increased at a cumulative annual growth rate of 11% and 12% per year, respectively.
Figure 2. Changes in the number and rate of US ischemic stroke and TIA transfers, 2006–2014.
(A) The number of acute care transfers over time is estimated using sampling weights and strata from the nationwide emergency department (ED) sample, which is an approximate 20% sample of US ED visits. (B) To correct for double-counting, the rate denominator includes nontransferred patient visits only.
In sensitivity analyses, eliminating the calculation correcting for double-counting results in a similar increase of transfer rates. In the absence of this correction, the estimated nationwide transfer rates per 100 ED visits for IS/TIA increased from 3.3 (95% CI 2.9–6.7) in 2006 to 7.0 (95% CI 6.7–7.3) in 2014 (figure e-1, links.lww.com/WNL/A409). Age-standardization of transfer rates results in an increase in point estimation due to younger patients receiving greater weight in direct standardization methods; however, the changes in transfer rates were similar (figure e-2).
Patient characteristics
Compared to nontransferred patients with IS/TIA (i.e., ED admissions and discharges), transferred patients were more often male (50% vs 46%; p < 0.001), younger (mean age 67 vs 71 years; p < 0.001), privately insured (25% vs 20%; p < 0.001), from nonmetropolitan/micropolitan areas (48% vs 16%; p < 0.001), had lower illness severity (mean weighted Charlson score 0.6 vs 1.3; p < 0.001), and were more likely to arrive on the weekend (28% vs 26%; p < 0.001) (table e-1, links.lww.com/WNL/A410). In addition, IS transfers received thrombolysis less often than admitted patients (1.5% vs 5.6%; p < 0.001), with no change in the rate of thrombolysis for IS transfers from 2006 to 2014 (p trend = 0.13).
Hospital characteristics
The database contained 8,110 samplings of ED units across all years. ED characteristics associated with high unadjusted IS/TIA transfer rates per 100 ED visits include those without neurosurgical procedures (mean 23.3 vs 3.4; without vs with, p < 0.001), low volume (mean 31.8 vs 1.9; 1st vs 4th quartile, p < 0.001), low-income-serving institutions (mean 22.9 vs 12.3; low-income-serving vs other, p < 0.001), Midwest regional location (mean 20.3 vs 11.9; Midwest vs other, p < 0.001), as well as rural (mean 24.9 vs 7.6; rural vs urban, p < 0.001) and nonteaching hospitals (mean 17.2 vs 2.3; nonteaching vs teaching, p < 0.001). Temporal changes in transfer rates from 2006 to 2014 by individual ED characteristics can be found in tables e-2–e-4 (links.lww.com/WNL/A410).
Changes in hospital-based ED transfer rates
The mean transfer rate among individual EDs increased from 8.2 per 100 ED visits for IS/TIA (interquartile range [IQR] 0–10.2) in 2006 to 19.4 per 100 ED visits (IQR 1.1–33.3) in 2014 (p < 0.001) (table e-2, links.lww.com/WNL/A410). Mean IS transfer rates increased from 11.1 to 25.3 per 100 ED visits from 2006 to 2014 (p < 0.001) and were higher than TIA transfer rates in all years, which increased from a mean of 4.5 to 10.8 per 100 ED visits from 2006 to 2014 (p < 0.001) (tables e-3 and e-4).
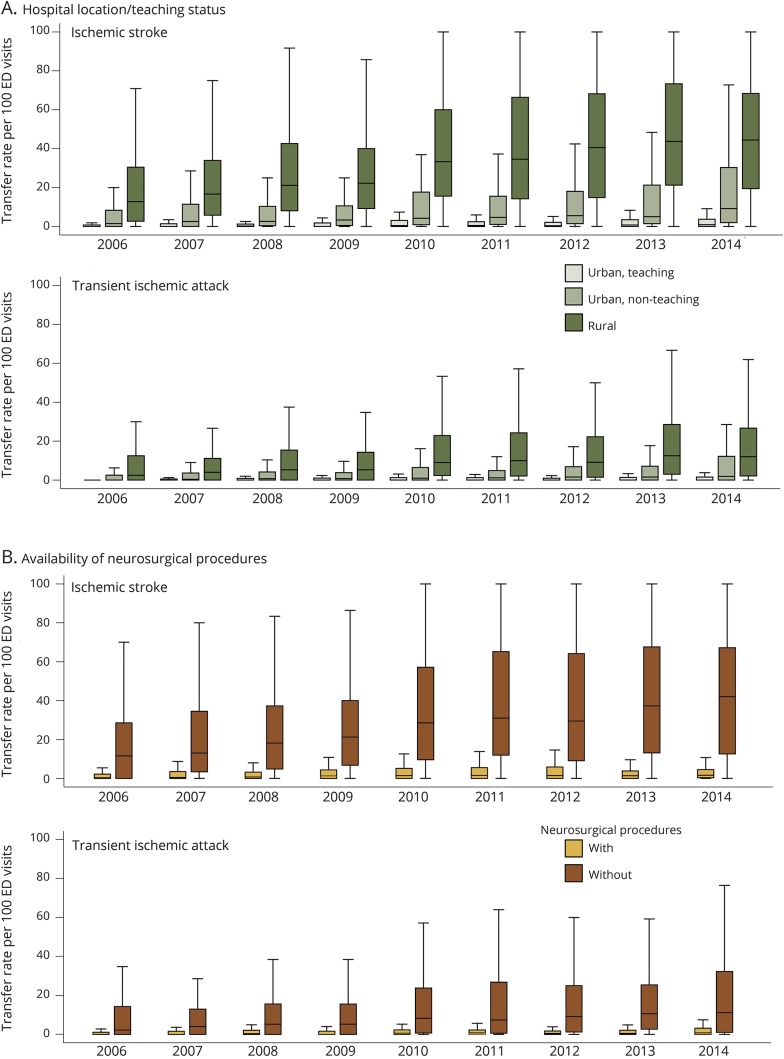
The proportion of EDs in the sample that transferred more than half of IS/TIA patient visits increased from 1.8% (n = 16) in 2006 to 14.5% (n = 128) in 2014 (p < 0.001). Increases in ED transfer rates were greatest for IS, and greatest among rural EDs (figure 3A) and those hospitals without the availability of neurosurgical procedures (figure 3B). Among 304 unique EDs that were sampled in both 2006 and 2014, 53 were teaching, 134 were urban nonteaching, and 117 were rural. The mean absolute difference in IS/TIA transfer rates from 2006 to 2014 for rural institutions was 15.8 per 100 ED visits (median 12.7, IQR 3.7–27.8), 9.2 per 100 ED visits for urban nonteaching institutions (median 1.6, IQR 0–12.4), and 0.7 per 100 ED visits for urban teaching institutions (median 0.3, IQR 0–1.2) (figure 4).
Figure 3. Box and whisker plot of emergency department (ED) transfer rates.
ED transfer rates for ischemic stroke and TIA by (A) hospital location/teaching status and (B) availability of neurosurgical procedures, 2006–2014. Outliers not shown.
Figure 4. Change in the rate of ischemic stroke and TIA transfers for emergency departments (EDs) sampled in 2006 and 2014.
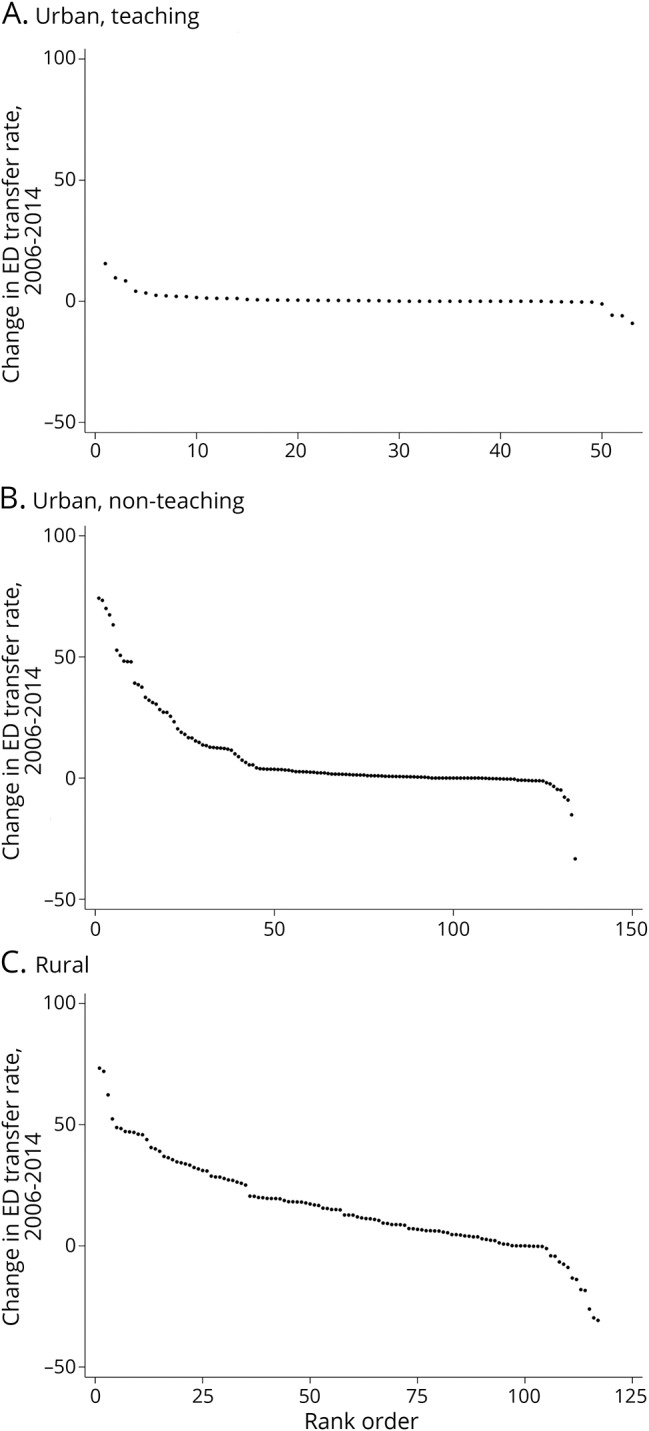
(A) Urban, teaching. (B) Urban, nonteaching. (C) Rural. Each point represents a unique ED within the dataset. The Y-axis represents the difference in ED transfer rate from 2006 to 2014.
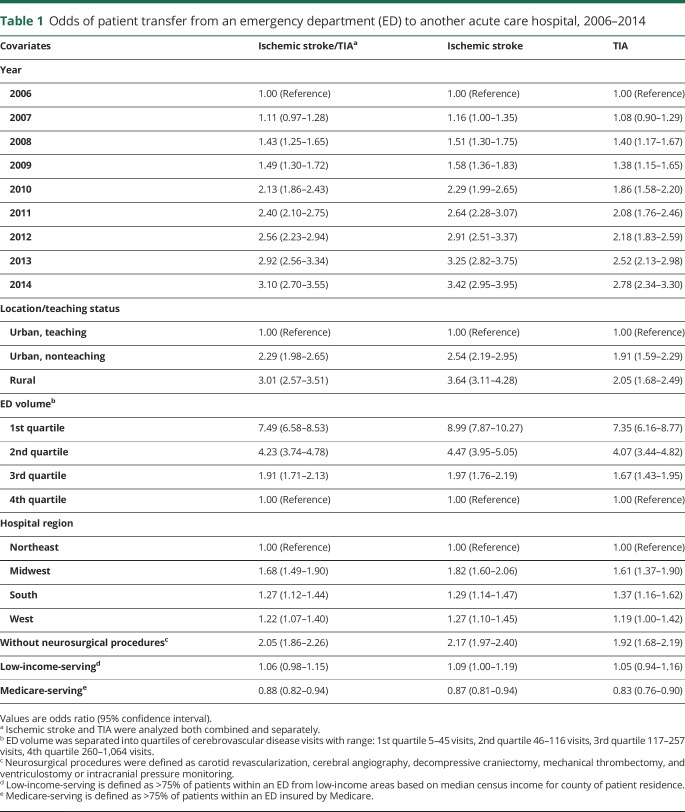
In a hospital-level model, the adjusted odds of transfer increased approximately 3-fold from 2006 to 2014 for IS/TIA patients (adjusted odds ratio [AOR] 3.10, 95% CI 2.70–3.55; 2014 vs 2006) (table 1). In addition, rural hospitals (AOR 3.05, 95% CI 2.56–3.64; vs urban teaching hospitals), low-volume centers (AOR 7.49, 95% CI 6.58–8.53; 1st vs 4th quartile), hospitals in the Midwest (AOR 1.73, 95% CI 1.52–1.97; vs Northeast), and hospitals without the availability of neurosurgical procedures (AOR 1.99, 95% CI 1.80–2.21; vs with neurosurgical procedures) were more likely to transfer IS and TIA patients.
Table 1.
Odds of patient transfer from an emergency department (ED) to another acute care hospital, 2006–2014
Discussion
Our study has at least 3 important new findings. First, transfers for IS and TIA nationwide doubled from 2006 to 2014, and the adjusted odds of transfer increased approximately 3-fold. By 2014, ∼1 in 10 IS and ∼1 in 20 TIA ED patient visits in the United States underwent an interhospital transfer.
Second, only 1.5% of patients nationwide with a diagnosis of IS who underwent an interhospital transfer received tPA at the transferring site. These figures are comparable to prior estimates of thrombolysis for stroke within rural hospitals,15,16 where many transferred patients arrive for their initial care. These estimates are small compared to a prior single comprehensive stroke center study of transferred-in patients, which found over one-quarter of transferred patients received tPA and transferred patients had more disabling strokes.17 The discrepancy may be explained by the difference between the US national average within an administrative database and the experience of a large comprehensive stroke center using data reported to Get With the Guidelines. While some accepting centers may have efficient means of preventing otherwise unnecessary transfers18 through well-developed interhospital relationships (e.g., telemedicine or telestroke),19 these hub-and-spoke connections are likely variable in their deployment.
Third, individual ED transfer rates were highly variable, ranging from no patients transferred to 100% of patients transferred for stroke, and from no patients transferred to ∼75% of patients transferred for TIA. Rates were high among rural hospitals, which transferred stroke patients at an average of ∼50 per 100 visits and TIA patients at an average of ∼20 per 100 visits. Furthermore, rural hospitals were more likely to have large increases in their transfer rates over time. This finding supports that vascular neurology care is highly specialized and urbanized, which may be due to limited access to neurologic specialty or subspecialty expertise or appropriate imaging modalities (e.g., MRI, angiographic imaging) within small volume and rural hospitals. We additionally found a small subset of rural and nonteaching hospitals that are transferring fewer patients. This could be a positive effect from telemedicine or telestroke,2 or may suggest a small proportion of institutions are gravitating toward greater independence and perhaps seeking stroke center designation.
Interhospital transfers for all neurologic conditions are high relative to other conditions.20 Our findings may reflect a sense of neurophobia among community hospital providers, which is a well-described phenomenon among medical trainees and may extend into general medical practice.21,22 This concept underscores the need for improved relationships between specialized stroke centers and small rural health centers, as well as cross-discipline education, guidance through telestroke and telemedicine networks, and improved strategies to better protocolize and screen for patients requiring higher level of care.19 These patients may include those receiving thrombolytics,3 candidates for endovascular intervention with large vessel occlusions,23,24 those in need of carotid revascularization, or those at risk for malignant cerebral edema or neurointensive care services.
There are opportunities to improve transfer selection. (1) Hospital-to-hospital TIA transfer rates are high and continue to increase despite evidence to support rapid evaluation outpatient TIA clinics,25–27 which could divert TIA transfers. Despite the evidence, performance of rapid evaluation outpatient TIA clinics is not well-understood in the United States and access likely remains limited in rural and many urban areas. (2) Similarly, transfers of small subcortical or lacunar strokes could potentially be avoided if these patients were cared for within spoke hospitals under the guidance of the hub. However, this would ultimately be limited by the availability of cardiac monitoring, MRI, angiographic imaging, and echocardiography. (3) Some have examined tools for early identification of endovascular candidates,28,29 as well as those with or without need for neurologic intensive care following tPA.30 Similar tools could be used for prehospital stroke patient routing or drip and ship candidates, whereby patients with probable large vessel occlusions could be directed by emergency medical services to endovascular-capable centers,31 and those at low risk who are not endovascular candidates could be transported to the nearest primary stroke center and avoid subsequent transfer. It is unclear how such advancements in prehospital32 or in-hospital triage systems have affected interfacility stroke transfer practices to date.
Improved selection of transfers may come with major financial benefits. Transportation charges from ambulance providers vary from thousands of dollars for ground transportation to tens of thousands of dollars for air transportation, and often, patients bear the costs.5,33 Prior studies on the critically ill have found transfers are more costly than front-door patients on average, and cost differences stem from those with the lowest level of disease severity.34 Therefore, improved patient selection for transfers has the potential to be cost-saving. However, this would need to be balanced with the cost of developing cerebrovascular expertise or telemedicine within low-volume centers.35 Also, any means to improve efficiency should to be balanced with the need to improve access to specialized, time-sensitive interventions such as thrombectomy.
Our study has several important limitations. Transfers may be dependent on a variety of patient, hospital, regional, or seasonal factors including geography or weather conditions, payer mix, hospital ownership or market competition, hospital resources, stroke center designation, hospital–hospital relationships, disease severity, and patient/family preference. We are unable to account for the full breadth of factors that contribute to a decision to transport a patient with stroke or TIA such as stroke center designations and stroke severity. Our analysis conducted on the hospital level relies on the averaging of patient-related factors over individual emergency departments—whereas stroke severity and other acuity-sensitive factors are likely to vary across different transferring emergency departments. We additionally rely on ICD-9 codes that are subject to error within an administrative dataset. Furthermore, the transferring hospital provided the diagnosis for transferred patients and many community hospitals without neurologic expertise may be subject to more diagnostic error (i.e., stroke mimics) than larger, teaching hospitals with the availability of neurologic expertise. Over the timeframe of the study, the transferring hospital may have had less incentive to accurately code for tPA administration. This may overestimate overall transfer rates, and underestimate overall thrombolysis rates for transferred patients. Finally, this analysis includes data through 2014, which predates the publication of multiple clinical trials supporting the use of mechanical thrombectomy for some acute stroke patients.36–41 It is possible that transfer rates have increased in response to these results and as such our results may represent an underestimate of current transfer practices.
Our study also has strengths. Our work uses a nationally representative sample with the power to estimate nationwide temporal changes in interfacility transfers for both IS and TIA. This study finds a consistently increasing rate of acute care transfer for stroke and TIA patients, which highlights the importance of further understanding the need, burden, and costs associated with these transfers to optimize patient outcomes and the value of services provided.
Glossary
- AOR
adjusted odds ratio
- CI
confidence interval
- ED
emergency department
- HCUP
Healthcare Cost and Utilization Project
- ICD-9
International Classification of Disease, 9th Revision
- IQR
interquartile range
- IS
ischemic stroke
- NEDS
Nationwide Emergency Department Sample
- tPA
tissue plasminogen activator
Footnotes
CME Course: NPub.org/cmelist
Editorial, page 821
Author contributions
Dr. George had full access to the data and takes responsibility for the accuracy of the analysis and results presented herein. Benjamin P. George: study concept or design, acquisition of the data, first draft of the manuscript, critical revision of the manuscript for important intellectual content, statistical analysis, interpretation of the analysis. Sarah J. Doyle: critical revision of the manuscript for important intellectual content, interpretation of the analysis. Ania Busza: critical revision of the manuscript for important intellectual content, interpretation of the analysis. Robert G. Holloway: acquisition of the data, critical revision of the manuscript for important intellectual content, interpretation of the analysis. Kevin N. Sheth: critical revision of the manuscript for important intellectual content, interpretation of the analysis. Adam G. Kelly: study concept or design, critical revision of the manuscript for important intellectual content, interpretation of the analysis, study supervision.
Study funding
No targeted funding reported.
Disclosure
B. George, S. Doyle, G. Albert, and A. Busza report no disclosures relevant to the manuscript. R. Holloway serves as consultant for MCG Guidelines. K. Sheth serves on the Editorial Advisory Board for Neurology Today. A. Kelly reports no disclosures relevant to the manuscript. Go to Neurology.org/N for full disclosures.
References
- 1.Pervez MA, Silva G, Masrur S, et al. Remote supervision of IV-tPA for acute ischemic stroke by telemedicine or telephone before transfer to a regional stroke center is feasible and safe. Stroke 2010;41:e18–e24. [DOI] [PMC free article] [PubMed] [Google Scholar]
- 2.Silva GS, Farrell S, Shandra E, Viswanathan A, Schwamm LH. The status of telestroke in the United States: a survey of currently active stroke telemedicine programs. Stroke 2012;43:2078–2085. [DOI] [PubMed] [Google Scholar]
- 3.Sheth KN, Smith EE, Grau-Sepulveda MV, Kleindorfer D, Fonarow GC, Schwamm LH. Drip and ship thrombolytic therapy for acute ischemic stroke: use, temporal trends, and outcomes. Stroke 2015;46:732–739. [DOI] [PubMed] [Google Scholar]
- 4.Rothwell PM, Giles MF, Chandratheva A, et al. Effect of urgent treatment of transient ischaemic attack and minor stroke on early recurrent stroke (EXPRESS study): a prospective population-based sequential comparison. Lancet 2007;370:1432–1442. [DOI] [PubMed] [Google Scholar]
- 5.Eavis P. Air ambulances offer a lifeline, and then a sky-high bill [online]. Available at: nytimes.com/2015/05/06/business/rescued-by-an-air-ambulance-but-stunned-at-the-sky-high-bill.html. Accessed July 12, 2017.
- 6.Nacht J, Macht M, Ginde AA. Interhospital transfers from US emergency departments: implications for resource utilization, patient safety, and regionalization. Acad Emerg Med 2013;20:888–893. [DOI] [PubMed] [Google Scholar]
- 7.Adeoye O, Albright KC, Carr BG, et al. Geographic access to acute stroke care in the United States. Stroke 2014;45:3019–3024. [DOI] [PMC free article] [PubMed] [Google Scholar]
- 8.Introduction to the HCUP nationwide emergency department sample [online]. Available at: hcup-us.ahrq.gov/db/nation/neds/NEDS2013Introduction.pdf. Accessed July 12, 2017.
- 9.Westfall JM, McGloin J. Impact of double counting and transfer bias on estimated rates and outcomes of acute myocardial infarction. Med Care 2001;39:459–468. [DOI] [PubMed] [Google Scholar]
- 10.HCUP methods series: population denominator data for use with the HCUP databases [online]. Available at: hcup-us.ahrq.gov/reports/methods/2014-02.pdf. Accessed July 27, 2017.
- 11.Goldstein LB, Samsa GP, Matchar DB, Horner RD. Charlson Index comorbidity adjustment for ischemic stroke outcome studies. Stroke 2004;35:1941–1945. [DOI] [PubMed] [Google Scholar]
- 12.Moradiya Y, Crystal H, Valsamis H, Levine SR. Thrombolytic utilization for ischemic stroke in US hospitals with neurology residency program. Neurology 2013;81:1986–1995. [DOI] [PMC free article] [PubMed] [Google Scholar]
- 13.Adeoye O, Hornung R, Khatri P, Kleindorfer D. Recombinant tissue-type plasminogen activator use for ischemic stroke in the United States: a doubling of treatment rates over the course of 5 years. Stroke 2011;42:1952–1955. [DOI] [PMC free article] [PubMed] [Google Scholar]
- 14.Kleindorfer D, Lindsell CJ, Brass L, Koroshetz W, Broderick JP. National US estimates of recombinant tissue plasminogen activator use: ICD-9 codes substantially underestimate. Stroke 2008;39:924–928. [DOI] [PubMed] [Google Scholar]
- 15.George BP, Asemota AO, Dorsey ER, et al. United States trends in thrombolysis for older adults with acute ischemic stroke. Clin Neurol Neurosurg 2015;139:16–23. [DOI] [PubMed] [Google Scholar]
- 16.Kansara A, Chaturvedi S, Bhattacharya P. Thrombolysis and outcome of young stroke patients over the last decade: insights from the Nationwide Inpatient Sample. J Stroke Cerebrovasc Dis 2013;22:799–804. [DOI] [PubMed] [Google Scholar]
- 17.Ali SF, Singhal AB, Viswanathan A, Rost NS, Schwamm LH. Characteristics and outcomes among patients transferred to a regional comprehensive stroke center for tertiary care. Stroke 2013;44:3148–3153. [DOI] [PubMed] [Google Scholar]
- 18.Fuentes B, Alonso de Lecinana M, Ximenez-Carrillo A, et al. Futile interhospital transfer for endovascular treatment in acute ischemic stroke: the Madrid stroke network experience. Stroke 2015;46:2156–2161. [DOI] [PubMed] [Google Scholar]
- 19.Higashida R, Alberts MJ, Alexander DN, et al. Interactions within stroke systems of care: a policy statement from the American Heart Association/American Stroke Association. Stroke 2013;44:2961–2984. [DOI] [PubMed] [Google Scholar]
- 20.Kindermann DR, Mutter RL, Houchens RL, Barrett ML, Pines JM. Emergency department transfers and transfer relationships in United States hospitals. Acad Emerg Med 2015;22:157–165. [DOI] [PubMed] [Google Scholar]
- 21.Jozefowicz RF. Neurophobia: the fear of neurology among medical students. Arch Neurol 1994;51:328–329. [DOI] [PubMed] [Google Scholar]
- 22.Schon F, Hart P, Fernandez C. Is clinical neurology really so difficult? J Neurol Neurosurg Psychiatry 2002;72:557–559. [DOI] [PMC free article] [PubMed] [Google Scholar]
- 23.Sauser Zachrison K, Schwamm LH. Implementation of rapid treatment and interfacility transport for patients with suspected stroke by large-vessel occlusion: in one door and out the other. JAMA Neurol 2017;74:765–766. [DOI] [PMC free article] [PubMed] [Google Scholar]
- 24.McTaggart RA, Yaghi S, Cutting SM, et al. Association of a primary stroke center protocol for suspected stroke by large-vessel occlusion with efficiency of care and patient outcomes. JAMA Neurol 2017;74:793–800. [DOI] [PMC free article] [PubMed] [Google Scholar]
- 25.Wasserman J, Perry J, Dowlatshahi D, et al. Stratified, urgent care for transient ischemic attack results in low stroke rates. Stroke 2010;41:2601–2605. [DOI] [PubMed] [Google Scholar]
- 26.Joshi JK, Ouyang B, Prabhakaran S. Should TIA patients be hospitalized or referred to a same-day clinic? A decision analysis. Neurology 2011;77:2082–2088. [DOI] [PubMed] [Google Scholar]
- 27.Dutta D, Bowen E, Foy C. Four-year follow-up of transient ischemic attacks, strokes, and mimics: a retrospective transient ischemic attack clinic cohort study. Stroke 2015;46:1227–1232. [DOI] [PubMed] [Google Scholar]
- 28.Asimos AW, Ward S, Brice JH, Rosamond WD, Goldstein LB, Studnek J. Out-of-hospital stroke screen accuracy in a state with an emergency medical services protocol for routing patients to acute stroke centers. Ann Emerg Med 2014;64:509–515. [DOI] [PubMed] [Google Scholar]
- 29.Katz BS, McMullan JT, Sucharew H, Adeoye O, Broderick JP. Design and validation of a prehospital scale to predict stroke severity: Cincinnati prehospital stroke severity scale. Stroke 2015;46:1508–1512. [DOI] [PMC free article] [PubMed] [Google Scholar]
- 30.Faigle R, Sharrief A, Marsh EB, Llinas RH, Urrutia VC. Predictors of critical care needs after IV thrombolysis for acute ischemic stroke. PLoS One 2014;9:e88652. [DOI] [PMC free article] [PubMed] [Google Scholar]
- 31.Southerland AM, Johnston KC, Molina CA, Selim MH, Kamal N, Goyal M. Suspected large vessel occlusion: should emergency medical services transport to the nearest primary stroke center or bypass to a comprehensive stroke center with endovascular capabilities? Stroke 2016;47:1965–1967. [DOI] [PMC free article] [PubMed] [Google Scholar]
- 32.Hanks N, Wen G, He S, et al. Expansion of U.S. emergency medical service routing for stroke care: 2000–2010. West J Emerg Med 2014;15:499–503. [DOI] [PMC free article] [PubMed] [Google Scholar]
- 33.Rosenthal E. Think the E.R. Is expensive? Look at how much it costs to get there [online]. Available at: nytimes.com/2013/12/05/health/think-the-er-was-expensive-look-at-the-ambulance-bill.html. Accessed July 12, 2017.
- 34.Golestanian E, Scruggs JE, Gangnon RE, Mak RP, Wood KE. Effect of interhospital transfer on resource utilization and outcomes at a tertiary care referral center. Crit Care Med 2007;35:1470–1476. [DOI] [PubMed] [Google Scholar]
- 35.Demaerschalk BM, Switzer JA, Xie J, Fan L, Villa KF, Wu EQ. Cost utility of hub-and-spoke telestroke networks from societal perspective. Am J Manag Care 2013;19:976–985. [PubMed] [Google Scholar]
- 36.Saver JL, Goyal M, Bonafe A, et al. Stent-retriever thrombectomy after intravenous t-PA vs. t-PA alone in stroke. N Engl J Med 2015;372:2285–2295. [DOI] [PubMed] [Google Scholar]
- 37.Goyal M, Demchuk AM, Menon BK, et al. Randomized assessment of rapid endovascular treatment of ischemic stroke. N Engl J Med 2015;372:1019–1030. [DOI] [PubMed] [Google Scholar]
- 38.Campbell BC, Mitchell PJ, Kleinig TJ, et al. Endovascular therapy for ischemic stroke with perfusion-imaging selection. N Engl J Med 2015;372:1009–1018. [DOI] [PubMed] [Google Scholar]
- 39.Berkhemer OA, Fransen PS, Beumer D, et al. A randomized trial of intraarterial treatment for acute ischemic stroke. N Engl J Med 2015;372:11–20. [DOI] [PubMed] [Google Scholar]
- 40.Jovin TG, Chamorro A, Cobo E, et al. Thrombectomy within 8 hours after symptom onset in ischemic stroke. N Engl J Med 2015;372:2296–2306. [DOI] [PubMed] [Google Scholar]
- 41.Nogueira RG, Jadhav AP, Haussen DC, et al. Thrombectomy 6 to 24 hours after stroke with a mismatch between deficit and infarct. N Engl J Med 2018;378:11–21. [DOI] [PubMed] [Google Scholar]


