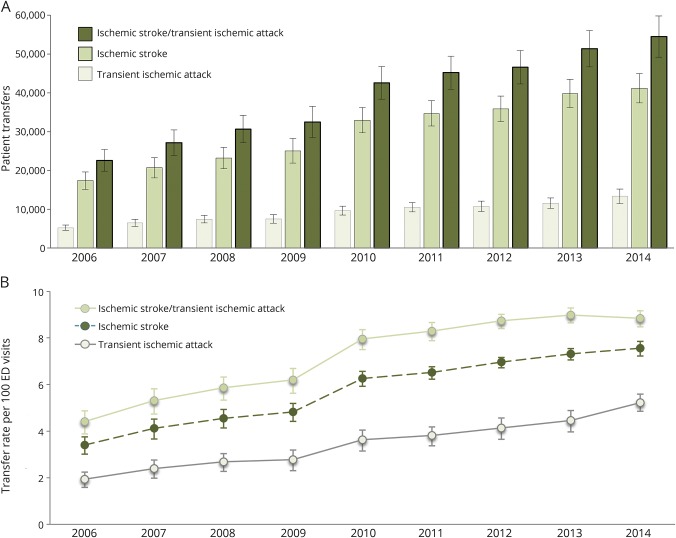
Figure 2. Changes in the number and rate of US ischemic stroke and TIA transfers, 2006–2014.
(A) The number of acute care transfers over time is estimated using sampling weights and strata from the nationwide emergency department (ED) sample, which is an approximate 20% sample of US ED visits. (B) To correct for double-counting, the rate denominator includes nontransferred patient visits only.

