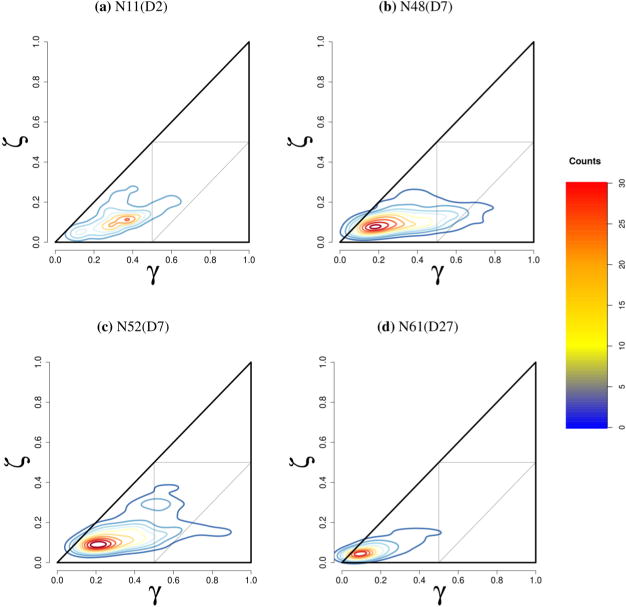
Figure 6.

Plot of given aggregates shape conformations as a function of γ and ζ parameters over the course of a given trajectory. Note that no samples should exceed the triangular boundaries because both γ and ζ are the squares of the ratios of the principle moments, but that this is an artifact of kernel density estimation.
