Fig. 3.

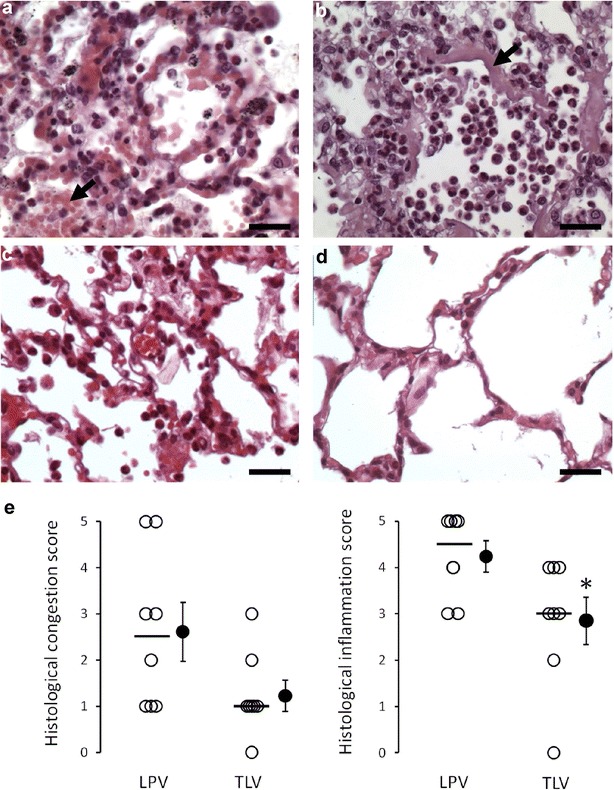
Histological appearance of the lungs in the group submitted to gaseous lung protective ventilation (LPV) or total liquid ventilation (TLV). a Histological appearance of the lung in a rabbit from the LPV group with leukocytic alveolitis and severe congestion, evidenced by intra-alveolar red blood cells infiltration (arrow; Bar = 25 µm). b Severe lesions of leukocytic alveolitis in a rabbit from the LPV group. The arrow illustrates hyaline membranes, as a marker of severe alveolar lesions (Bar = 25 µm). c Histological appearance of the lung in a rabbit from the TLV group with moderate alveolitis and congestion (Bar = 25 µm). d Normal histological appearance of the lung in a rabbit from the TLV group (Bar = 25 µm). e Histological scores of the severity of the congestive and inflammatory lesions in the different groups (n = 8 in each LPV and TLV group). Open circles represent the individual value of each animal, and the bold line illustrates the median score of each group, respectively. Closed circles represent mean and standard of the mean of each group. *p < 0.05 versus LPV
