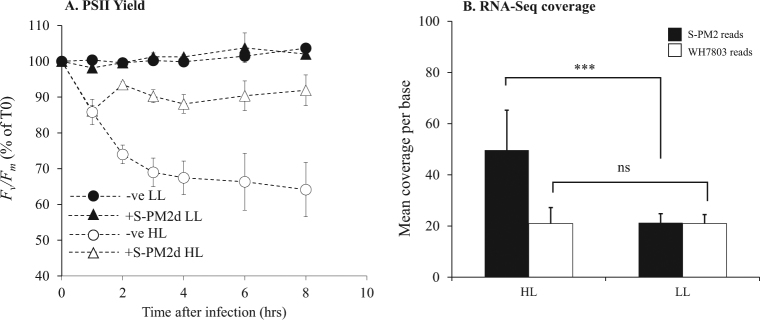
Fig. 2.
The effect of light intensity on Synechococcus photophysiology and cyanophage gene expression. a Maximum quantum yield of PSII photochemistry. Unfilled circles (uninfected) and triangles (infected) are samples subjected to the HL treatment and filled circles and triangles are LL. Samples are normalised to time 0. For raw data see Figure S4. b Mean per base coverage of the transcriptome across the Synechococcus host and cyanophage S-PM2d genome. Filled bars are S-PM2d reads and unfilled bars are Synechococcus sp. WH7803 reads. ***p < 0.001, NS not significant. Error bars represent SD from the mean

