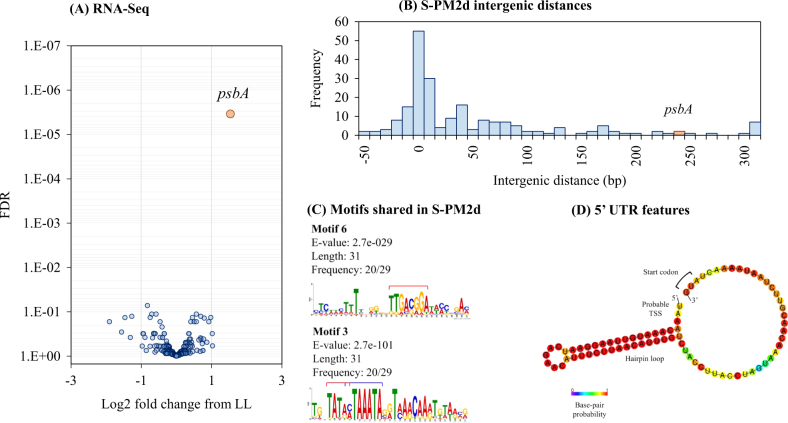
Fig. 3.
The effect of light intensity on global gene expression. a A volcano plot showing the log2 fold change of gene expression relative to the LL treatment. The y-axis shows the false discovery rate corrected p-value calculated using edgeR. The orange circle shows statistically significant differential gene expression by edgeR. b Histogram of intergenic sequence lengths across the cyanophage S-PM2d genome. The bin containing psbA is shown in orange. c DNA sequence motifs found upstream of cyanomyoviral psbAs. Red bars indicate −35 and −10 elements of the σ70 binding sites and the blue bar shows the late σ factor Gp55-binding site. d Predicted hairpin loop folding structure of the S-PM2d psbA 5′-UTR

