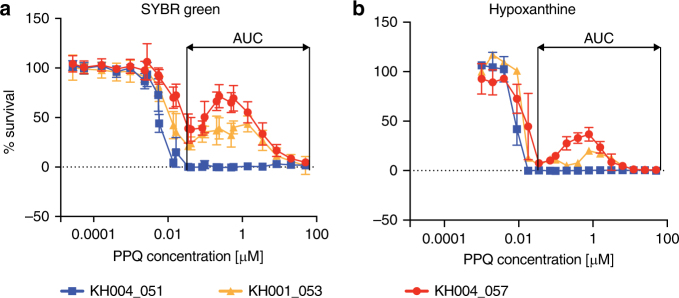
Fig. 1.
Bimodal distribution of parasite response to PPQ exposure. The Area Under the Curve (AUC) value was determined using the local minima as boundaries to describe the parasite response to PPQ. Increasing the starting concentration and number of data points for the conventional SYBR Green dose–response curve a provided a better curve representation and brought percent survival to zero at higher concentrations. Bimodal growth was observed with increasing PPQ concentrations for a subset of parasites. Representative PPQ-resistant parasites KH004_057 (red) and KH001_053 (orange) and a PPQ-sensitive parasite KH004_051 (blue) are shown. Similar data for all 37 isolates tested can be found in Supplementary Fig. 1. Hypoxanthine assays b confirmed that these dose–response results were derived from viable parasites. All drug assays were done in triplicate and repeated two times, with the mean and s.d. shown for each concentration

