Fig. 3.
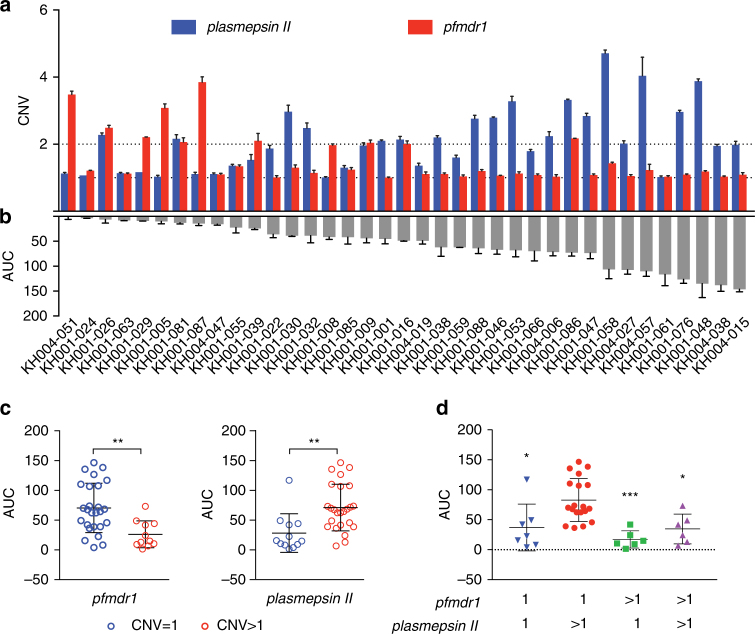
AUC correlates overall with plasmepsin II copy numbers but there are exceptions. a shows CNVs for plasmepsin II (blue) and pfmdr1 (red) that were estimated based upon average read depth of whole-genome sequencing data (+ s.d.) and confirmed by quantitative real-time polymerase chain reaction. b shows the Area Under the Curve (AUC) for the parasite lines tested (N = 3, mean+ s.d.). c shows the distribution of all parasite lines binned into CNV of 1 (blue) or> 1 (red, average > 1.6) for pfmdr1 or plasmepsin II, relative to the AUC values, to show the negative correlation for pfmdr1 (unpaired Student’s t-test, p = 0.0021, ** p < 0.01) and the positive correlation for plasmepsin II (p = 0.0023). d Combining pfmdr1 and plasmepsin II CNVs, only parasites with pfmdr1 = 1 and plasmepsin II > 1 CNVs are significantly different than the other combinations in regards to the AUC (one-way ANOVA, Tukey corrected). * p < 0.05, ** p < 0.01. Each data point in c and d represents the mean of three independent assays run in triplicate. The overall mean and s.d. is shown with black bars

