Fig. 7.

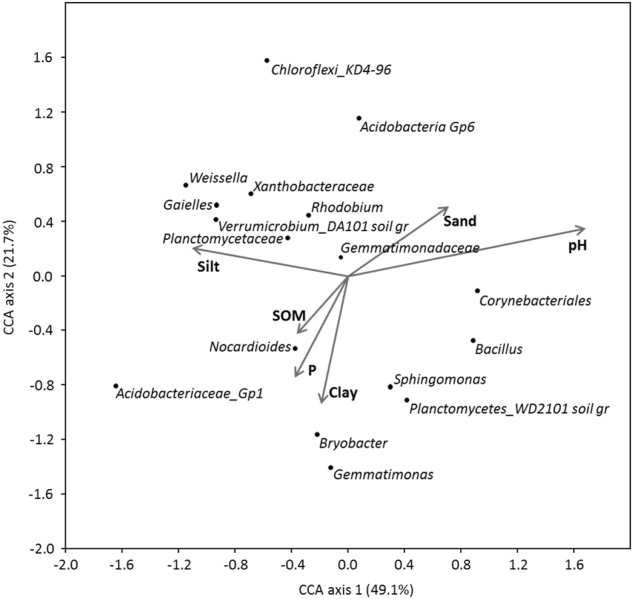
Canonical correspondence analysis (CCA) between genus- or higher-level relative abundance and environmental variables (Expt. 2). Only taxa contributing to >1 % relative abundance of all taxa are included in the plot

Canonical correspondence analysis (CCA) between genus- or higher-level relative abundance and environmental variables (Expt. 2). Only taxa contributing to >1 % relative abundance of all taxa are included in the plot