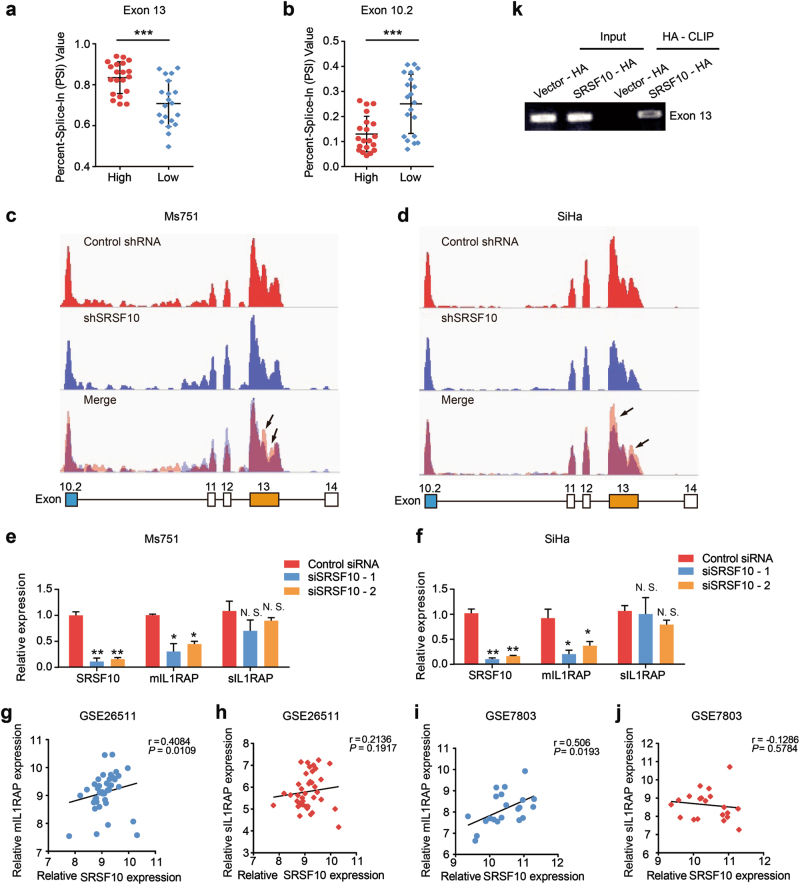
Fig. 4.
SRSF10 promotes the generation of mIL1RAP in CC. (a, b Quantification of AT of IL1RAP exon 13 and 10.2 in the high SRSF10 group (n = 20) and low SRSF10 group (n = 20) in the TCGA CESC data set (described in Supplementary Fig. S2A) measured as the PSI (percent splicing index). c, d Schematic diagram of RNA-seq reads covering SRSF10 exons 10.2–14 in shSRSF10 and control shRNA CC cells. In the merged diagram, reads of control shRNA are showed as orange, shSRSF10 as blue and overlap as purple. The arrow showed the exclusion of exon 13 after SRSF10 knockdown. e, f The AS of mIL1RAP and sIL1RAP affected by SRSF10 knockdown were examined in Ms751 and SiHa cells. Ms751 and SiHa cells were transiently transfected with either SRSF10-knockdown siRNAs (siSRSF10-1, siSRSF10-2) or control siRNA. RNAs extracted from siSRSF10 and control siRNA cells were examined by RT-PCR. g–j The correlation analysis between SRSF10 and mIL1RAP or sIL1RAP was observed in CC samples of GSE26511 (n = 28) and GSE7803 (n = 21). k In vitro CLIP from SiHa cells with primer pairs complementary to human IL1RAP exon 13 by RT-PCR. Siha cells were transiently transfected with either HA-tagged SRSF10 (SRSF10-HA) or empty-vector control (Vector-HA). *P < 0.05; **P < 0.01; ***P < 0.001

