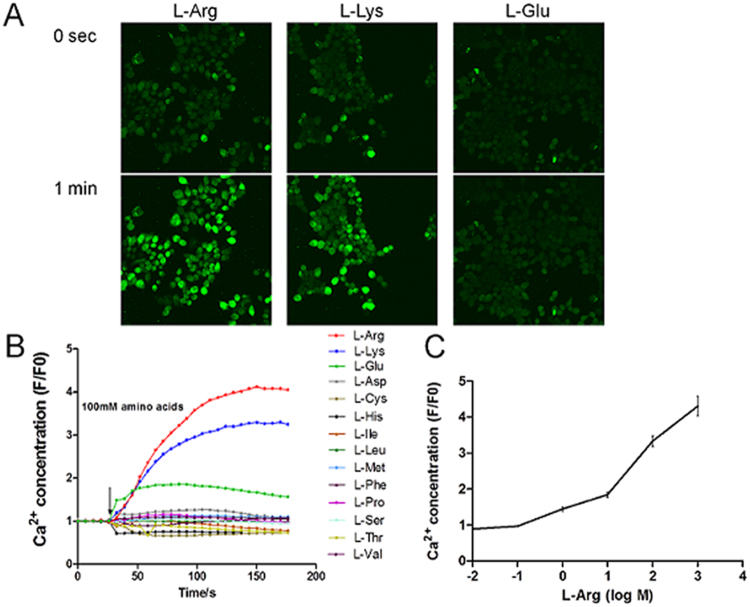
Figure 7.
Responses of HEK293T cells co-expressing grass carp T1R1 and T1R3 to tastant stimuli. (A) Representative radiometric images of fluo-4AM-loaded HEK293T cells during the application of 100 mM L-Arg, L-Lys and L-glu. Top and bottom panels show the cell images that were obtained 0 s and 1 min after stimulation, respectively. (B) The quantification of responses of grass carp T1R1- and T1R3-transfected cells. Amino acids were used at 100 mM. (C) Dose-dependent responses of grass carp T1R1 and T1R3 to L-Arg. Responses were normalized to the mean response before tastant stimuli.

