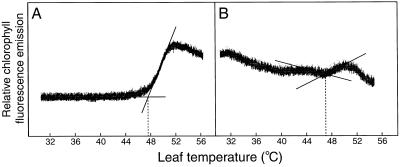
Figure 1.
Representative traces of the response of chlorophyll fluorescence emission to increasing leaf temperature. A, The response of Fo during exposure to compressed air (Fo traces during exposure to N2 as well as room air looked similar). B, The response of steady-state fluorescence during illumination with 1008 μmol photons m−2 s−1 and exposure to N2. The rate of leaf temperature increase was 1.7°C min−1. Both traces are from kudzu; however, the responses of the other species were similar. Methods for determining TC and the thermal breakpoint are exemplified.

