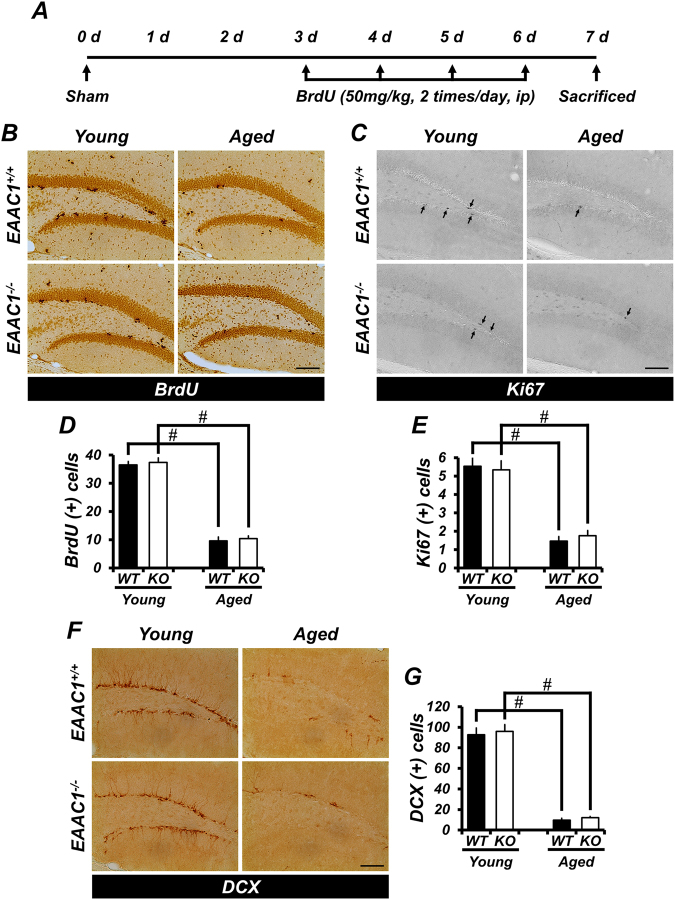
Figure 4.
Progenitor cell proliferation and neuroblast production are not different between WT and EAAC1−/− mice. (A) The schematic diagram shows the experimental procedure used in this study. BrdU was intraperitoneally injected twice per day for 4 consecutive days from day 3 after sham surgery. Mice were killed on day 7. (B,C,F) Representative images reveal BrdU- (B) Ki67- (C) and DCX-labeled cells (F) in the hippocampal DG of young and aged mice (WT or EAAC1−/−) at 7 days after sham surgery. The Ki67-expressing cells are indicated by an arrow. Scale bar = 100 μm. (D,E,G) The bar graph shows the number of BrdU- (D) Ki67- (E), and DCX-labeled cells (G) in the SGZ from young and aged mice (WT or EAAC1−/−) at 7 days after sham surgery. Data are expressed as the mean + SEM; n = 6–10 from each group, #p < 0.05 versus young mice.

