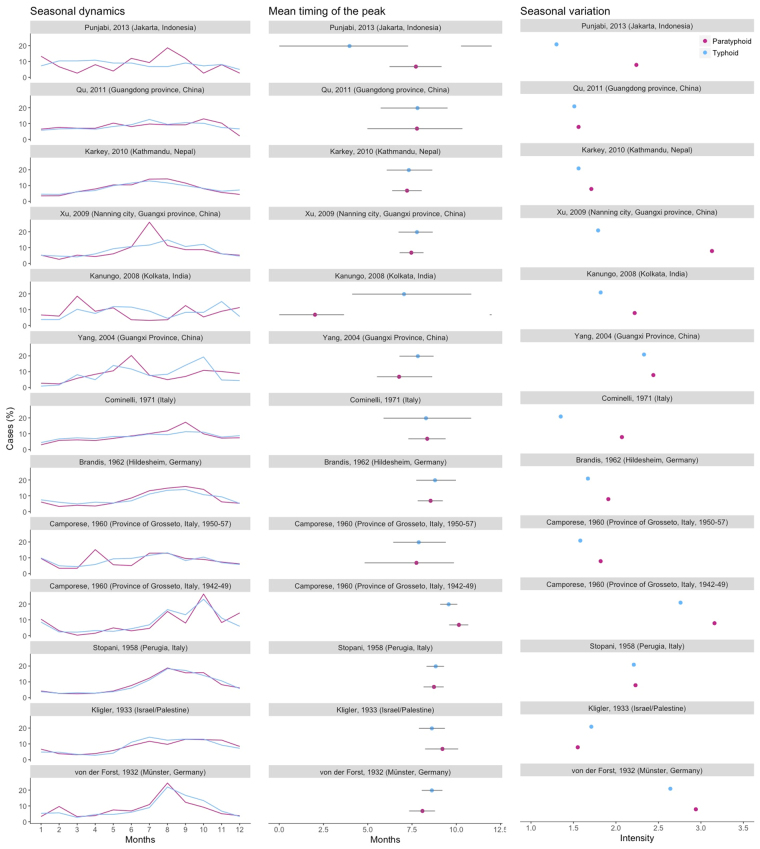
Figure 5.
Seasonal dynamics, mean timing of the peak and seasonal variation for studies with typhoid and paratyphoid data. On the left, the percent of annual cases occurring in each month are plotted for paratyphoid fever (purple) and typhoid fever (blue). In the middle, mean timing (as defined by center of gravity) is represented by the dots, while the line corresponds to the 95% confidence interval. On the right, the seasonal variation (peak/mean) is plotted.

