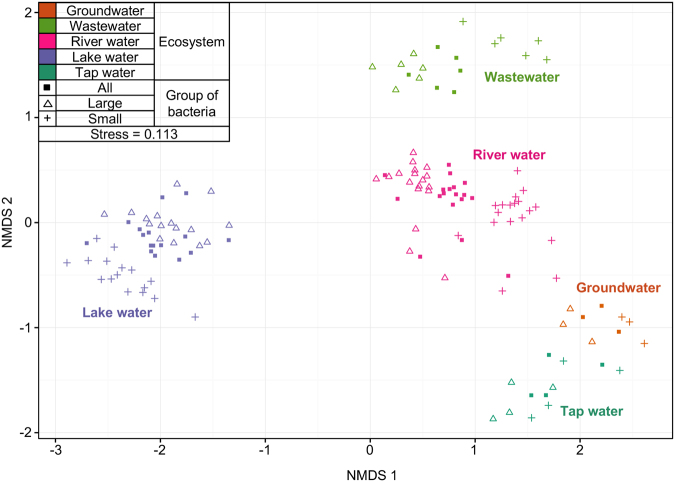
Fig. 4.
Non-metric multidimensional scaling (NMDS) of bacterial communities (characterized with 16 S amplicon sequencing) calculated with Bray–Curtis dissimilarity between samples from five different ecosystems (marked by color: Groundwater, Wastewater, River water, Lake water, and Tap water), with three different size groups by shape. ‘All bacteria’ is the total community, directly filtered onto a 0.2 µm filter. Large bacteria is the HNA-dominated community collected on a 0.4 µm filter, and Small bacteria is the LNA-dominated community in the 0.4 µm filtrate, collected on a 0.2 µm filter. In NMDS plots, points that are closer together represent bacterial communities more similar to each other than those further away. A low stress value indicates a robust diagram

