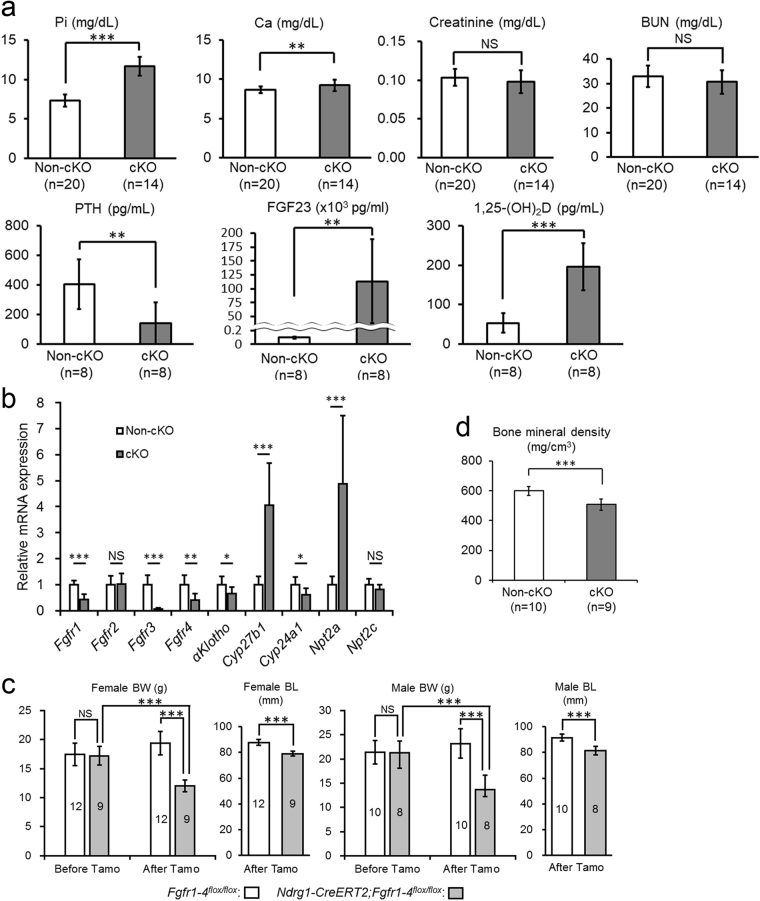
Figure 6.
Proximal tubule-specific Fgfr1–4 cKO reproduces the phenotypes of proximal tubule-specific αKlotho cKO. (a) Biochemical analysis of plasma inorganic phosphate (Pi), calcium (Ca), creatinine, blood urea nitrogen (BUN), parathyroid hormone (PTH), fibroblast growth factor 23 (FGF23), and 1,25-dihydroxyvitamin D (1,25(OH)2D) at 9 weeks of age at 3 weeks after the induction of Cre by tamoxifen treatment. These parameters were measured as described in the Methods section. Values are expressed as mean ± s.d. Number of samples (n) is described in the figure. (b) RT-qPCR of RNA extracted from the kidney. RT-qPCR was performed as described in the Methods section. Primers used for these studies are listed in the Supplementary Table S4. Values are expressed as mean ± s.d. of 8 samples for both non-cKO and cKO mice. (c) Mouse body size. Body weight (BW) was measured at 6 weeks of age before Cre induction and at 9 weeks of age at 3 weeks after Cre induction, whereas body length (BL) was measured only at 3 weeks after Cre induction. Data show a body size reduction in Fgfr1-4 cKO mice as compared with non-cKO control mice. Values are expressed as mean ± s.d. Number of animals used in each group is indicated in each bar graph. (d) Bone analysis. Bone mineral density of the femurs was analysed with micro-CT as described in the Methods section. Values are expressed as mean ± s.d. of 10 samples. Scale bar: 5 cm. Statistical significance between 2 groups was examined by a two-tailed unpaired Student’s t test, whereas the significance among more than 3 groups was analysed by one-way ANOVA followed by Tukey’s multiple comparison test. NS, not significantly different; *P < 0.05; **P < 0.01; ***P < 0.001. See also Supplementary Table S3.

