Fig. 5.
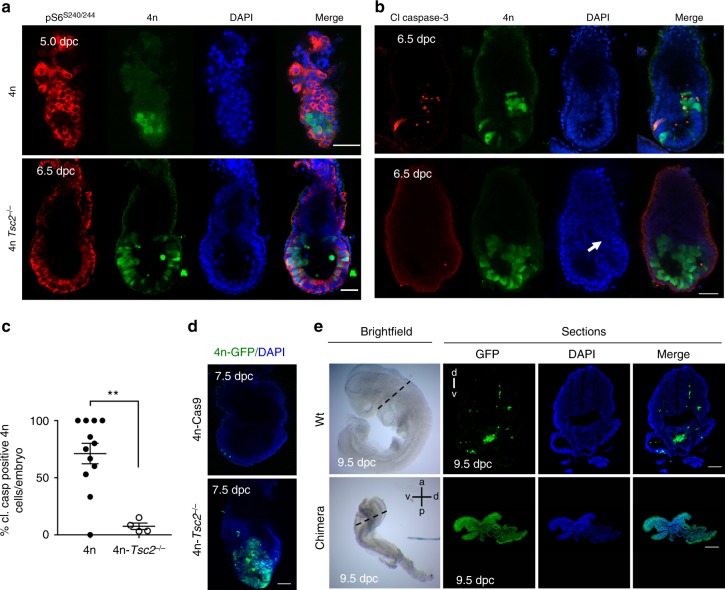
mTOR pathway repression is required for competition in vivo. a Chimeras generated by injecting 4n and 4n-Tsc2−/− cells into wild-type blastocysts. Levels of pS6 were analysed at 5.0 dpc and 6.5 dpc, respectively. b Chimeras generated by injecting 4n (n = 12) and 4n-Tsc2−/− (n = 4) cells into wild-type blastocysts. The white arrow indicates epiblast overgrowth of 4n-Tsc2–/– cells in these chimeras. Levels of cell death were assessed by cleaved caspase-3 staining at 6.5 dpc and quantified (c). d Chimeras generated by injecting 4n-Cas9-GFP and 4n-Tsc2−/−-GFP cells into wild-type blastocysts. Embryos were analysed for GFP expression to determine contribution of 4n cells. e 4n-Tsc2−/− GFP cells were injected into wild-type blastocysts, embryos were collected at 9 dpc, and levels of 4n Tsc2−/− GFP contribution were assessed by whole-mount immunofluorescence or by sectioning. Morphology of chimera is compared to wild-type control embryo. Scale bars are 50 μm for a, b and 100 μm for d, e. Error bars denote SEM (c). **p < 0.01; t-test

