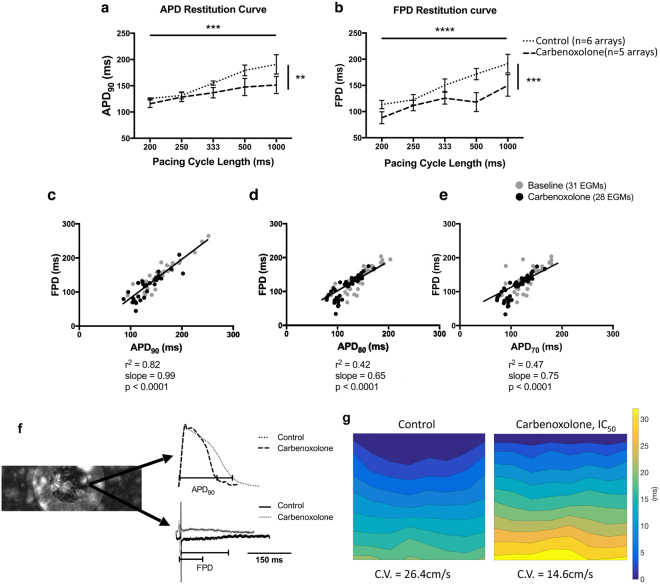
Figure 5.
Correlations between APD90 and FPD in cardiac myocyte cultures after the gap junction uncoupling. Effect of 15.8 μmol/L CBX on APD90 (a) and FPD (b) (Control: n = 6; CBX: n = 5). APD90 and FPD differed significantly both among pacing rates (p < 0.001 and p < 0.0001 respectively) and due to gap junction uncoupling (p < 0.01 and p < 0.001 respectively, ordinary two-way ANOVA). Linear regression correlating APD90 (c), APD80 (d) and APD70 (e) with FPD due to gap junction uncoupling by CBX (APD90: r2 = 0.847, slope = 0.99; APD80: r2 = 0.42, slope = 0.65; APD70: r2 = 0.47, slope = 0.75; p < 0.0001). (f) Superimposed raw traces obtained before and after gap junction blockade by CBX and the concurrent EGMs. The raw traces were obtained from the same electrode as indicated on the left. (g) Isochronal maps presenting the propagation of electrical activity before (26.4 cm/s) and after (14.6 cm/s) gap junction uncoupling in the same NRVM culture. All bar charts represent mean ± SEM; ***p < 0.001; ****p < 0.0001.

