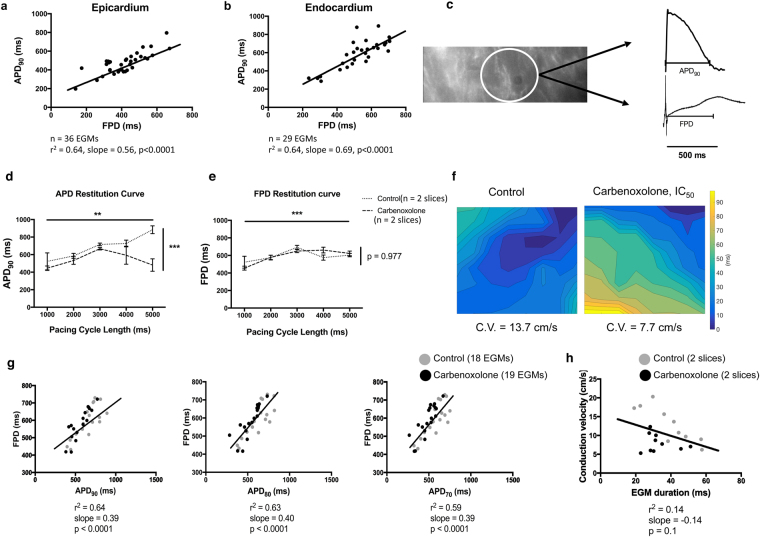
Figure 7.
Correlation between APD90 and FPD in human ventricular slices. (a,b) MEA and optical mapping recordings obtained simultaneously from human heart slices derived from the left ventricular epicardium (n = 36 EGMs, obtained from 8 slices in total) and endocardium (n = 29 EGMs, obtained from 6 slices in total) show that APD90 and FPD are strongly correlated in both sites (r2 = 0.64, p < 0.0001 for both cases). (c) Raw trace obtained during optical mapping from human epicardial ventricular slice and the concurrent EGM, as both derived from the same electrode presented on the left. It is highlighted that APD90 and FPD are similar (500 ms). Effect of 15.8 μmol/L CBX on APD90 (d) and FPD (e) (Control: n = 2; Carbenoxolone: n = 2). APD90 and FPD differed significantly both among pacing rates (p < 0.01 and p < 0.001 respectively) and APD90 only changed significantly due to gap junction uncoupling (p < 0.001, ordinary two-way ANOVA). (f) Isochronal maps presenting the AP propagation before (14.2 cm/s) and after (9.2 cm/s) gap junction uncoupling in adjacent tissue slices. The markedly slow conduction in the centre of the control slice is due to the presence of a fibrotic area within the slice preparation. (g) Linear regression correlating APD90, APD80 and APD70 with FPD using data before and after the CBX activity on neighbouring heart failure tissue slices (APD90: r2 = 0.64, slope = 0.39; APD80: r2 = 0.63, slope = 0.4; APD70: r2 = 0.59, slope = 0.39; p < 0.0001). All bar charts represent mean ± SEM; **p < 0.01; ***p < 0.001. (h) Linear regression analysis correlating conduction velocity measured before and after gap junction uncoupling with the EGM duration of the data obtained under the same conditions (r2 = 0.14, slope = −0.14, p = 0.1).

