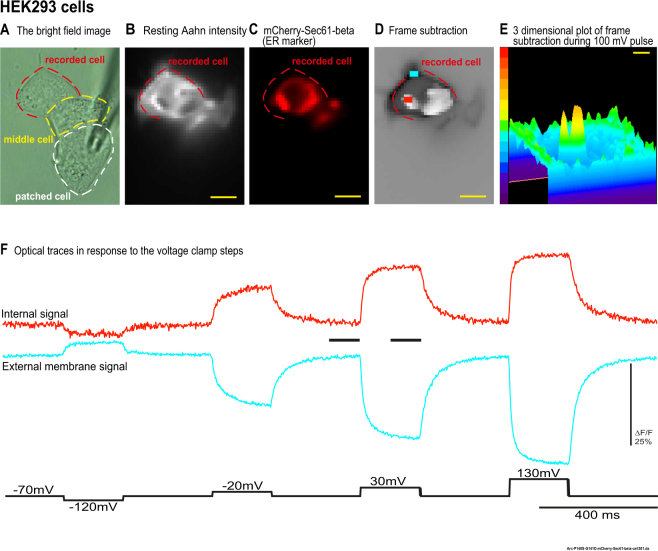
Figure 3.
The overlap between an ER marker and the internal signal area in HEK293 cells. HEK 293 cells co-expressing Aahn and mCherry-Sec. 61-beta were voltage-clamped. (A) The bright field image of the HEK293 cells. (B) The resting light image of the Aahn expression. (C) A red florescence protein (mCherry-Sec. 61-beta) was used as a marker for ER. (D) The frame subtraction image of the HEK293 cells in response to the 100 mV depolarization pulse (white indicates the internal signal and black indicates the external membrane optical signal). There is a substantial overlap between the area of the internal signal and the ER fluorescence. (E) The three dimensional plot of frame subtraction during the 100 mV depolarization pulse (F) The red and blue traces are representative fluorescent signals (average of first 4 trials) from internal membrane (red trace) and the plasma membrane (blue trace) respectively without temporal filtering. Images were recorded at a frame rate of 500 fps. Size bars represent 10 μm.

