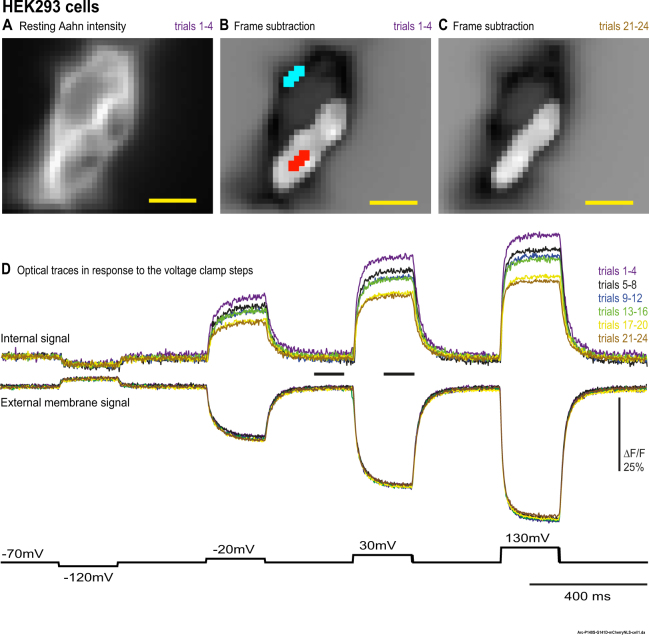
Figure 4.
The internal optical signal size decreases during repeated patch clamp measurements in HEK293 cells. A HEK 293 cell (same cell that was illustrated in Figs 1 and 2) expressing Aahn was voltage-clamped. The internal signal, but not the external signal, decreases with repeated trials. (A) The resting light image of the Aahn expression. (B,C) Frame subtraction images for the first 4 trials and the last 4 trials (trials 21–24) in response to the 100 mV depolarization pulse. The internal signal area is somewhat smaller in the last group of 4 trials. (D) The optical traces of internal and external signals for the six sets of four trials are shown. Each trace is the average of 4 trials without temporal filtering. Images were recorded at a frame rate of 500 fps. The size bar represents 10 μm.

