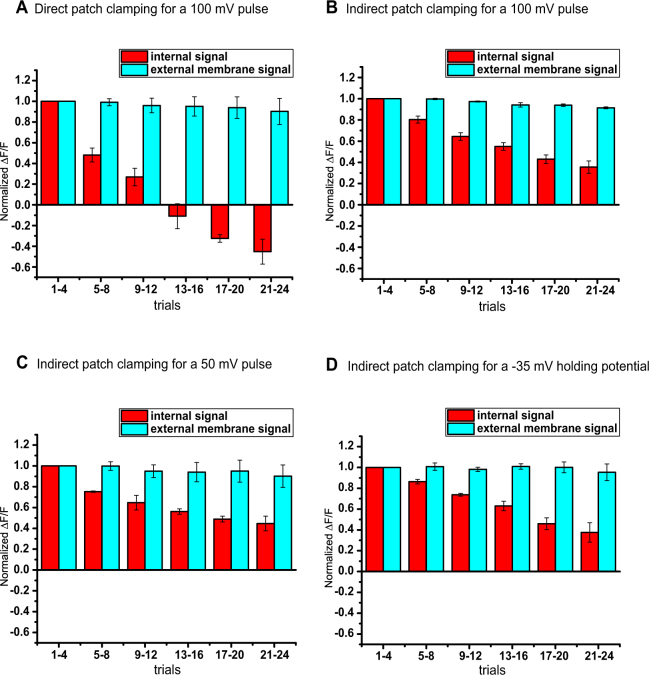
Figure 5.
The signal size during repeated patch clamp measurements. (A) Normalized internal and external membrane optical signal size for different trials in response to the 100 mV step. HEK239 cells expressing Aahn were voltage-clamped directly. (B) Normalized internal and external membrane optical signal size in response to the 100 mV step. HEK239 cells expressing Aahn were voltage-clamped indirectly. (C) Normalized internal and external membrane optical signal size in response to 50 mV steps. HEK239 cells expressing Aahn were voltage-clamped indirectly. (D) Normalized internal and external membrane optical signal size in response to the 100 mV step with a −35 mV holding potential. HEK239 cells expressing Aahn were voltage-clamped indirectly. The error bars represent the standard error of the mean (n = 3 cells for each plot).

