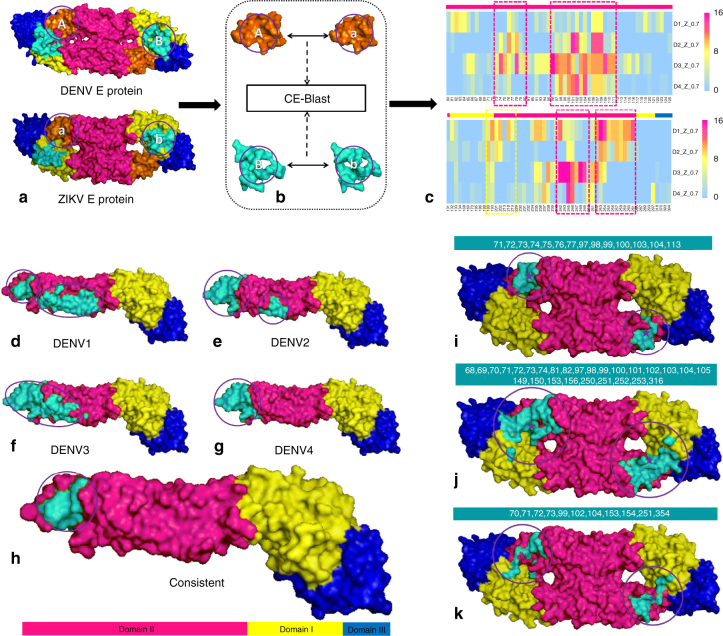
Fig. 5.
Predicting the potential cross-reactive epitope between DENV and ZIKV. a–c Workflow of the potential cross-reactive area (CRA) detection by CE-BLAST between ZIK and DENV. a: Two E antigens to be compared with domains I, II, and III marked in yellow, magenta, and blue, respectively; b: circular patches are screened and compared on the antigen surface; c: the cross-reactive frequency among sampling structures between corresponding patches predicted by CE-BLAST. Each patch is labeled by the center residue in the column, and each row represents four DENV types. Magenta dashed boxes show the consistent CRAs across different DENV subtypes, whereas yellow box shows the weak one. Residues in different domains are marked accordingly on the bars over the heat map. d–h Potential cross-reactive epitope (CRE) mapping to the E monomer structure of ZIKV. d–g: the predicted CRE is shown in turquoise for four DENV serotypes respectively; h: overlapping CRE of ZIKV across DENV subtypes. i–k Predicted CRE of the E dimer structure of ZIKV, compared with experimental results. i: predicted CRE by CE-BLAST for the E dimer; j: binding interface derived from the crystal structures (PDB id:5LCV); k: important residues computed by interaction force from Barba-Spaeth et al.22. All CREs have been circled for clarity

