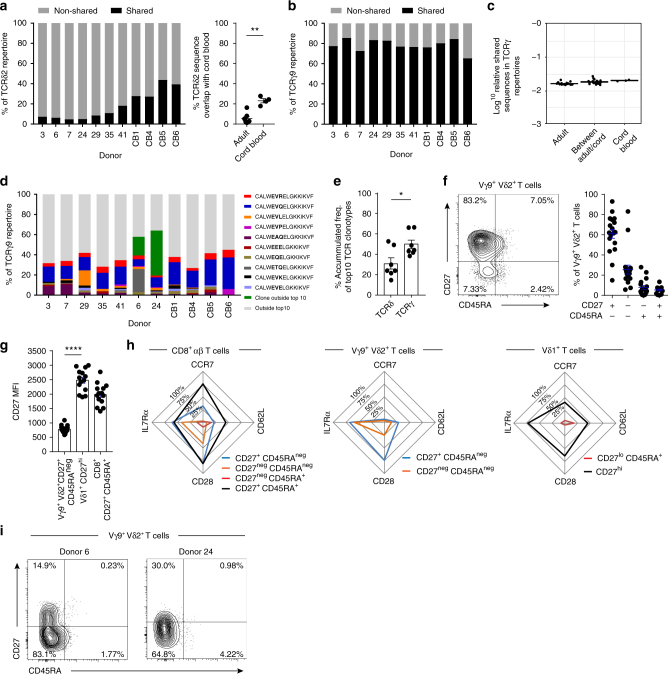
Fig. 2.
Vδ2+ TCR repertoires are formed of public clonotypes. a Percentage of CDR3δ sequences (amino acid) shared between > 2 donors within both adults and cord blood (left) and sequences shared with cord blood only (right). b Percentage of CDR3γ9 sequences (amino acid) shared between >2 donors (public sequences). c Comparison of the sequence overlap (relative publicity) of TCRγ9 repertoires in adult peripheral blood donors (n = 7) or cord blood samples (n = 3) and then between both groups. d Frequency of each of the 10 most common clonotypes in each donor’s TCRγ9 repertoire, with the addition of exceptional expanded shared clonotypes usually found outside the top 10 (dark green). e Comparison of the accumulated repertoire frequency occupied by the first 10 clonotypes in Vδ2+ TCRδ and γ (n = 7). f CD27 and CD45RA T-cell memory marker expression by Vγ9+ Vδ2+ T cells from adult peripheral blood samples (n = 18). g Comparison of CD27 expression levels (MFI) on CD27+ CD45RAneg Vγ9+ Vδ2+ T cells (n = 18), CD27hi Vδ1+ (n = 14) and CD27+ CD45RA+ CD8+ T cells (n = 14) from adult peripheral blood samples. h Summary radar plot data detailing the mean % positive cells for each indicated T-cell marker analysed within each sub-population of Vγ9+ Vδ2+ (n = 18), Vδ1+ (n = 14) and CD8+ αβ T cells (n = 14). i Healthy adult peripheral blood donor 6 and 24’s expression of CD27 and CD45RA T-cell memory markers on Vγ9+ Vδ2+ T cells. Error bars indicate means ± SEM; *P < 0.05; **P < 0.01; ****P < 0.0001; p-values were determined by Student's t-test (a, e) and one-way ANOVA with Tukey’s post hoc testing (g)

