Fig. 1.
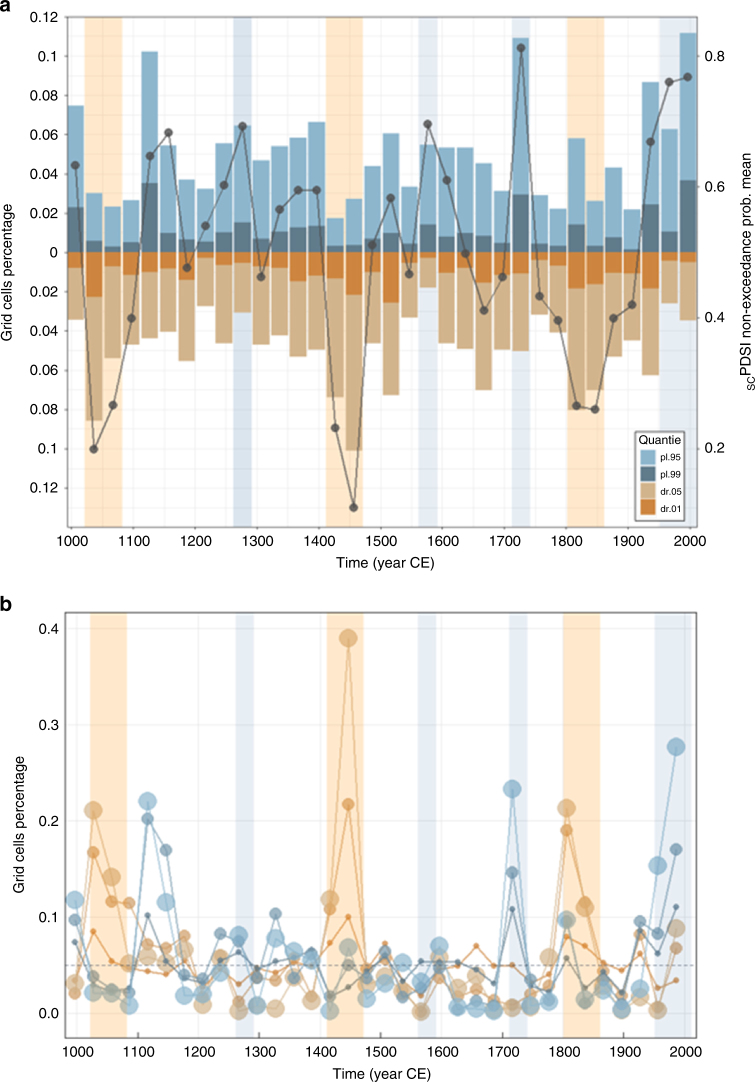
Long-term hydroclimatic change over Europe. a Mean of the non-exceedance probability (MNP) of the scPDSI for Europe at 30-year scale (black circled line) and percentage of grid cells with scPDSI in the top/bottom 0.05 and 0.01 quantiles per 30-year periods (blue and brown bars). Light orange and blue areas correspond to droughts and pluvials in the 30-year scale. b Percentage of grid cells with scPDSI in the top (bottom) 0.95 (0.05) quantile per 1-, 10- and 30-year period (blue and brown circles; size corresponds to scale, i.e., the smallest are in annual scale). Grey dashed line represents the nominal quantile value

