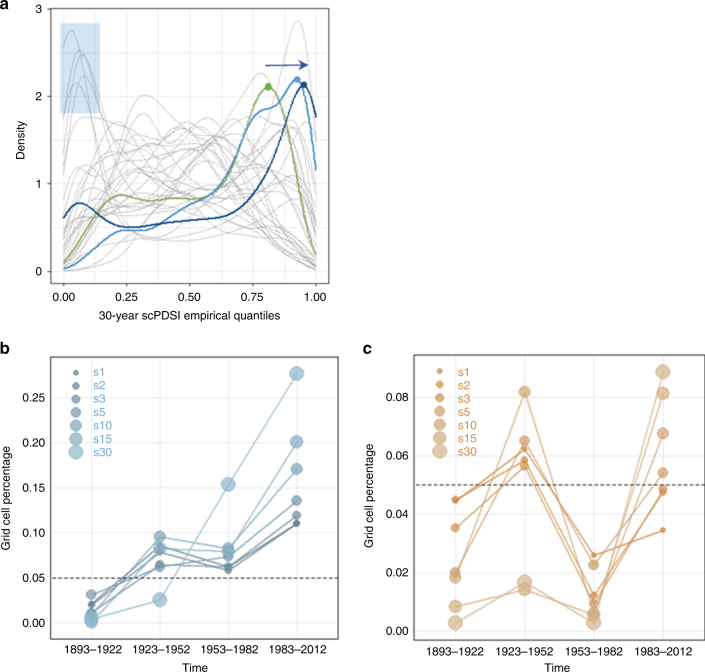
Fig. 2.
Temporal evolution of hydroclimatic conditions over 1892−2012. a Empirical probability densities of 30-year scPDSI values over Europe (grey lines: different 30-year intervals for the 992−1922 period, green line: 1923−1952 interval, light blue line: 1953−1982 interval, dark blue line: 1983−2012 interval). The blue arrow represents the temporal evolution of the last three 30-year intervals (green to light blue to deep blue). The dry periods are also highlighted by the blue transparent rectangle. Values close to zero (close to one) represent extremely dry (extremely wet) conditions. b Percentage of grid cells with scPDSI above the 0.95 quantile for time scales 1 to 30 years (extreme pluvial conditions). c Similar to b but for the bottom 0.05 quantile (extreme dry conditions). Grey dashed line represents the theoretical quantile value, i.e., the top/bottom 5% of the grid cells

