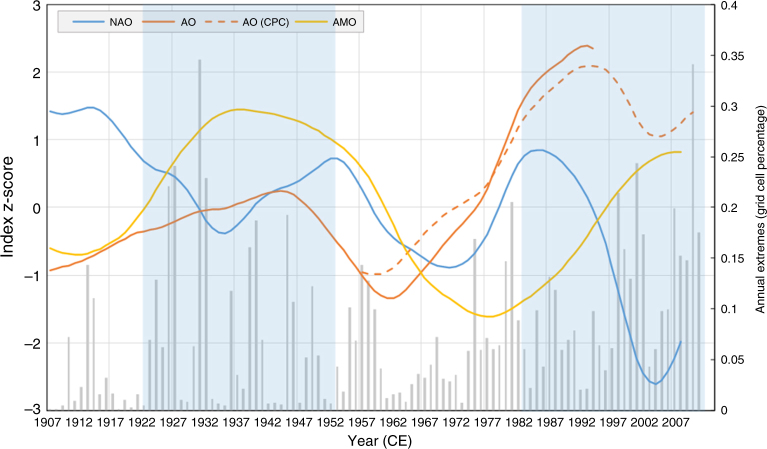
Fig. 8.
Annual pluvial extremes and major atmospheric/oceanic circulation indices. 30-year low-pass filter (loess) z-scores of annual North Atlantic Oscillation (NAO), Arctic Oscillation (AO, AO-CPC) and Atlantic Multidecadal Oscillation (AMO). All datasets extracted from the KNMI explorer online platform. Light blue shade represents the intervals 1923–1952 and 1983–2012. On the secondary vertical axis, the grid cell percentage of annual extremes (above the 0.95 quantile) is presented for comparison purposes (grey bars). The periods of spatial polarization are highlighted by transparent blue bars

