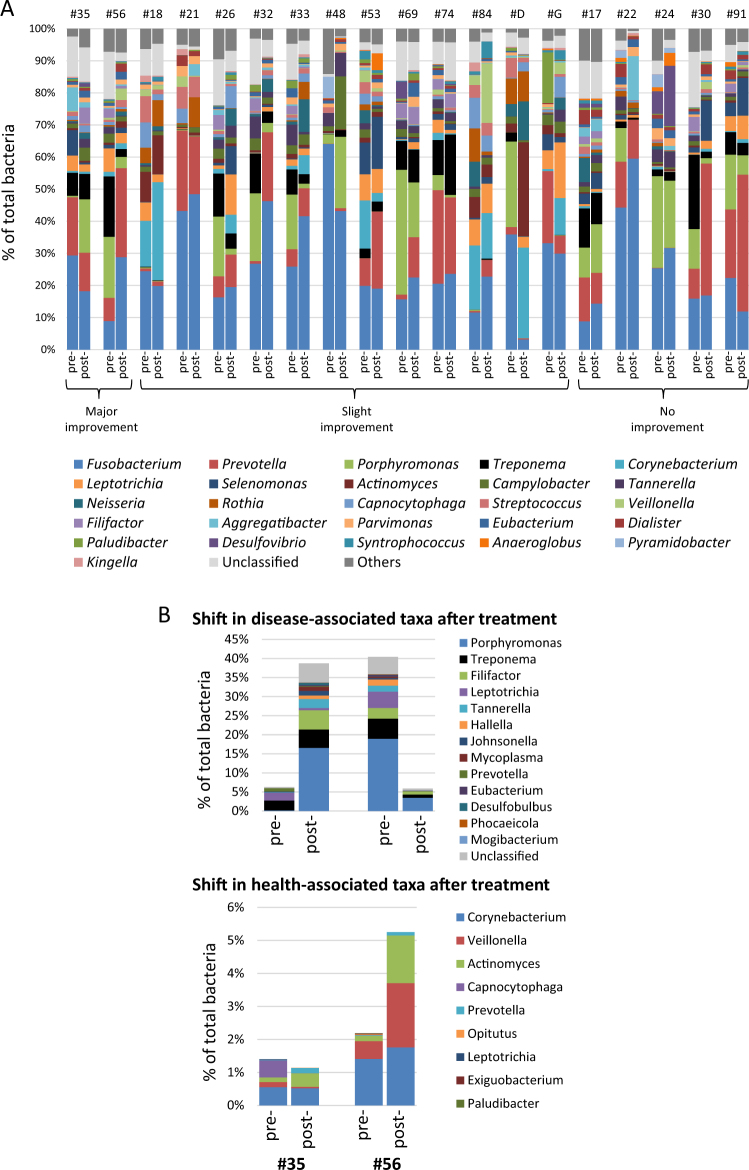
Fig. 2.
Site-specific microbiome before and after nonsurgical periodontal treatment. a The compositions of the pre- and post-treatment microbiome are shown side-by-side for each site (each from a different individual). The subject identification is provided at the top of the figure. The sites were defined by their treatment outcomes as effective (major improvement (MI): reduction in PPD of 2 mm or more, gain in CAL of 2 mm or more and a shift from BOP to no BOP), somewhat effective (slight improvement (SI): reduction in PPD by 1 mm and/or gain in CAL by 1 mm and a shift from BOP to no BOP), and ineffective (no improvement (NI): persistent BOP). The top 26 genera and unclassified genera that constituted approximately 95% of the microbiota are shown. Significant variations in microbiome were noted among individual sites irrespective of the treatment outcomes. b Examples of contrasting changes of microbiome between sites with comparable treatment outcomes. The levels of selected disease- and health-associated taxa (from Table 2) are shown

