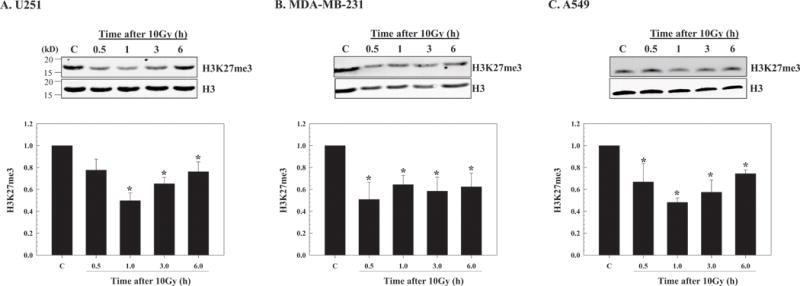
Figure 1.

Effect of radiation on H3K27me3 levels in tumor cell lines. A) U251, B) MDA-MB-231 and C) A549 cells were irradiated (10Gy) and chromatin protein isolated at the indicated time points. Top panels show representative immunoblots for H3K27me3 along with the corresponding H3 levels from each cell line. Bottom panels show H3K27me3 levels as a function of time after irradiation normalized to the unirradiated controls (C). H3 was used as a loading control; the data expressed as the mean ± SEM of 3-4 independent experiments. *p≤0.04 according to Student’s t test.
