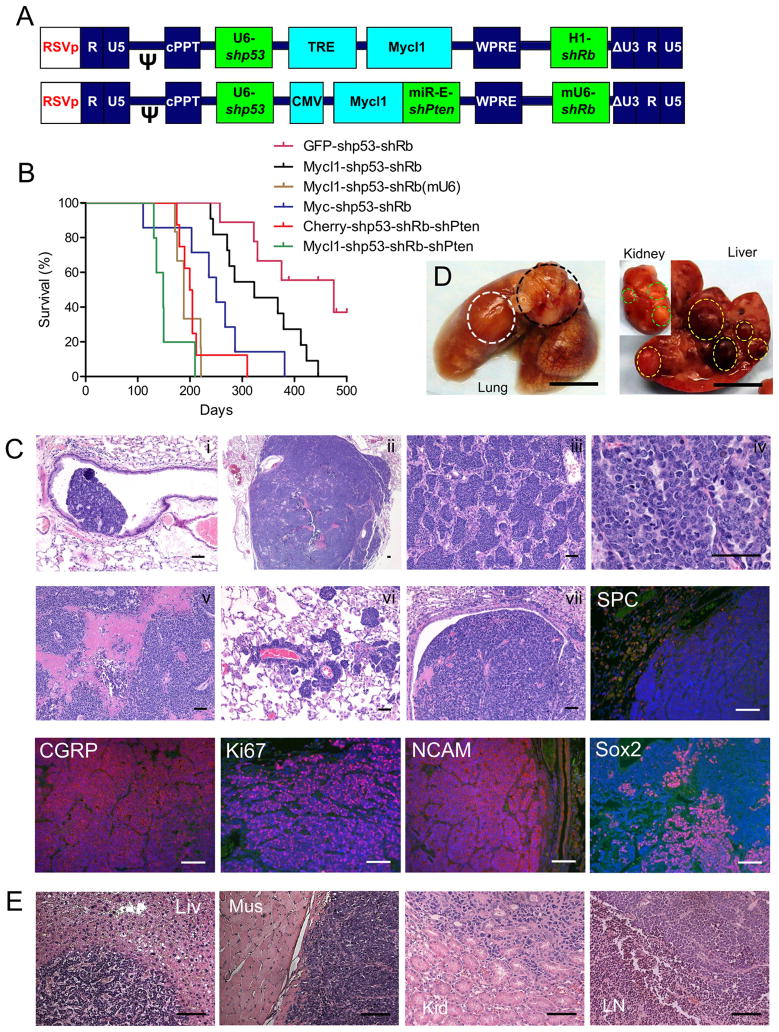
Figure 1. Lentiviral vector-mediated SCLC mouse model highly recapitulates human tumors.
(A) Schematic of transducing lentiviral vector. Mycl1 is controlled by a TRE promoter (top) and activated in Rosa26-M2rtTA mice upon doxycycline chow or directly by a CMV promoter (bottom). shPten is also driven by a CMV promoter in a miR-E backbone immediately after Mycl1, while other shRNAs are driven by U6 or H1 promoters. (B) Kaplan-Meier survival curves showing effects of lentiviral vector carrying different payloads. Median survival time of the groups was 475 days (GFP-shp53-shRb, n=9), 323 days (Mycl1-shp53-shRb, n=11), 188 days (Mycl1-shp53-shRb(mU6), n=6, shRb(mU6) has better Rb knockdown by mouse U6 promoter), 250 days (Myc-shp53-shRb, n=7), 201 days (Cherry-3shRNA, n=8), and 147 days (Mycl1-3shRNA, n=5), respectively. (C) Histopathological analysis of SCLC tumors induced by TRE-Mycl1-shp53-shRb vector, showing tumor initiating from bronchus (i), in low magnification view (ii), forming nested pattern (iii), in high magnification view (iv), forming massive necrosis (v), spreading along vasculature (vi), invading to big bronchus (vii). Tumors stained negative for SPC and positive for CGRP, Ki67, NCAM, Sox2. Scale bars, 100 μm. (D) View of whole lung, liver and kidney, showing primary lung tumor (white circle), metastases to mediastinal lymph node (black circle), liver (right, yellow circle) and kidney (right inset, green circle). Scale bars, 5 mm. (E) Histopathological analysis of metastases to liver, muscle, kidney and mediastinal lymph node. Scale bars, 100 μm.

