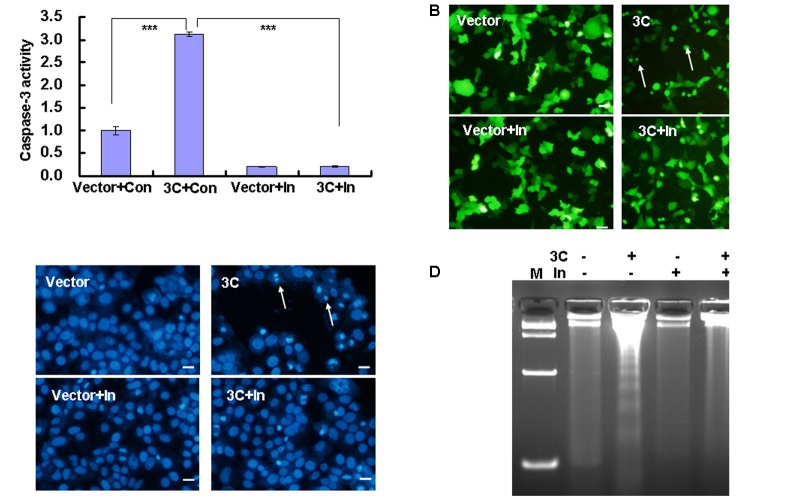
FIGURE 2.
Caspase-3 inhibitor inhibits caspase-3 activation and cytopathy in 3C-transfected cells. (A) Caspase-3 activity was analyzed by caspase-3/7 activity assay. Luminescence values in each group were calculated and normalized to 1.0 in VR1012-transfected and control-treated cells. The results indicate the means ± SD of three independent experiments. ∗∗∗P < 0.001. (B) Cell morphologic analysis and (C) nuclear morphologic analysis of HepG2 cells were performed 36 h after transfection with 4 μg of pEGFP-3C (3C) or the corresponding control vector pEGFP (Vector) with/without caspase-3 inhibitor. Bar = 20 μm. (D) DNA fragmentation was analyzed by agarose gel electrophoresis. M indicates marker. Data are representative of three individual experiments (n = 3). Con, 0.05% DMSO in 10% DMEM; In, caspase-3 inhibitor.

