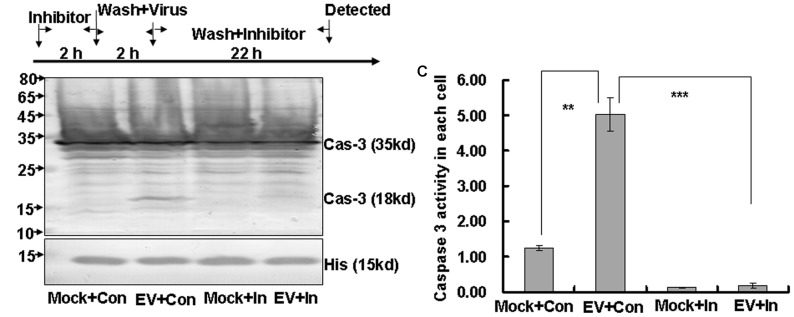
FIGURE 3.
Caspase-3 inhibitor inhibits caspase-3 activation in EV71 infected cells. (A) Flow diagram of RD cell treatment with caspase-3 inhibitor. RD cells were pre-treated with 20 μM caspase-3 inhibitor (Inhibitor) or 0.05% DMSO in 10% DMEM (Con) for 2 h. The cells were then washed with PBS and mock-infected or infected with EV71 at an MOI of 1. After 2 h, the cells were washed again with PBS and re-treated with 20 μM caspase-3 inhibitor or 0.05% DMSO in 10% DMEM (Con) for another 22 h. (B) Caspase-3 expression was analyzed by Western blotting. Histone is shown as a loading control. The results are representative of three independent experiments. (C) Caspase-3 activity was analyzed by caspase3/7 activity assay kits. Luminescence values were detected and cell numbers were calculated for standardization on a per cell basis. Mock, mock-infected; Con, 0.05% DMSO in 10% DMEM; EV, EV71 infection; In, caspase-3 inhibitor; Cas-3, caspase-3; His, histone. The results indicate the means ± SD of three independent experiments. ∗∗P < 0.01, ∗∗∗P < 0.001.

