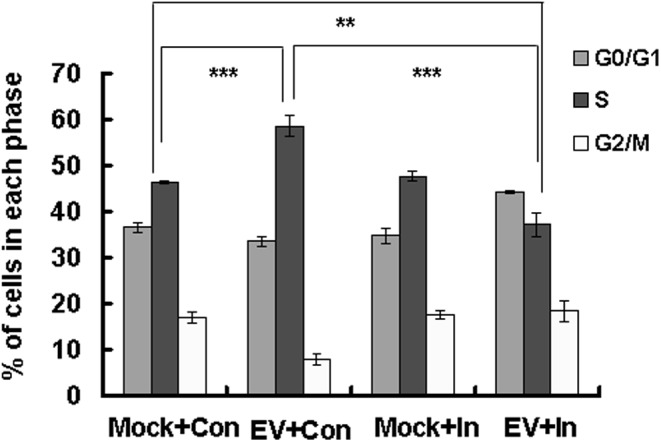
FIGURE 5.

Effect of caspase-3 inhibitor on the cell cycle status favored for EV71 viral production. RD cells were treated with 20 μM of caspase-3 inhibitor (In) or 0.05% DMSO in 10% DMEM (Con) for 2 h, and then mock-infected (Mock) or infected with EV71 (EV) at an MOI of 1. After 2 h, the cells were re-treated with caspase-3 inhibitor (In) or 0.05% DMSO in 10% DMEM (Con) for an additional 22 h. Cell-cycle profiles were determined by flow cytometry. Histograms show the percentage of cells in each phase of the cell cycle as analyzed by the ModFit LT program. The results indicate the means ± SD of three independent experiments. ∗∗P < 0.01, ∗∗∗P < 0.001.
