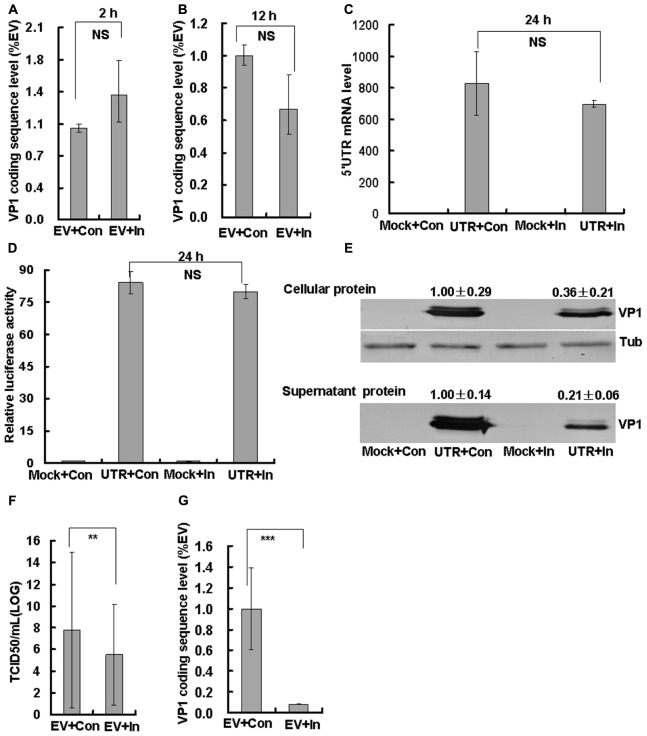
FIGURE 6.
Effect of caspase-3 inhibitor on EV71 viral production. RD cells were treated with 20 μM of caspase-3 inhibitor (In) or 0.05% DMSO in 10% DMEM (Con) for 2 h. Then the cells were mock-infected (Mock) or infected with EV71 (EV) at an MOI of 1. After 2 h, the cells were re-treated with caspase-3 inhibitor (In) or 0.05% DMSO in 10% DMEM (Con) for the indicated times. At 2 h (A) and 12 h (B) post-infection, intracellular EV71 RNA levels were detected in control or caspase-3 inhibitor-treated RD cells by real-time quantitative PCR. The results are standardized to GAPDH mRNA as a control and normalized to 1.0 in EV-infected cells. NS: No significant difference. (C,D) HepG2 cells in 12-well plates were transfected with 1 μg 5′UTR-pGL3-Basic and 50 ng pRenilla for 4 h. Then, 20 μM caspase-3 inhibitor or control medium was added for 20 h. At 24 h post-transfection, the 5′UTR mRNA level (C) was detected and standardized using GAPDH mRNA as a control and normalized to 1.0 in mock-transfected cells (transfected with pgl3-basic). Luciferase activity (D) was detected and normalized to 1.0 in mock-transfected cells. (E) VP1 expression in cellular lysates or in viral supernatants was determined after growth in control medium or caspase-3 inhibitor medium at 24 h post-infection. The numerical value shown is the ratio of VP1 protein intensity to the intensity in the caspase-3 inhibitor treatment group. The results are representative of three independent experiments. Tub: Tubulin. (F) Total progeny viruses (supernatant and cellular viruses) were titrated using RD cells at 24 h post-infection. Quantitative analysis of the TCID50/mL is detected and log10TCID50/mL is shown. The results indicate the means ± SD of three independent experiments. ∗∗P < 0.01. (G) At 24 h post-infection, supernatant EV71 RNA levels were detected in control or caspase-3 inhibitor-treated RD cells by real-time quantitative PCR. The results are standardized to GAPDH mRNA as a control and normalized to 1.0 in EV-infected and control-treated cells. The results indicate the means ± SD of three independent experiments. ∗∗∗P < 0.001.

