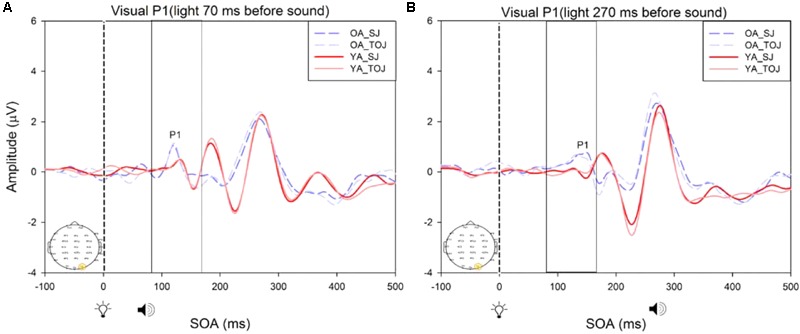
FIGURE 8.

Average amplitude (μV) of visual P1 ERPs from the between-subjects analysis obtained from the control condition from younger and older adults in response, and time-locked, to the flash stimulus (light bulb icon) from the visual-auditory conditions [sound, speaker icons, presented 70 ms after light (A) and 270 ms after light (B)] obtained from the O2 electrode for the TOJ and SJ tasks.
