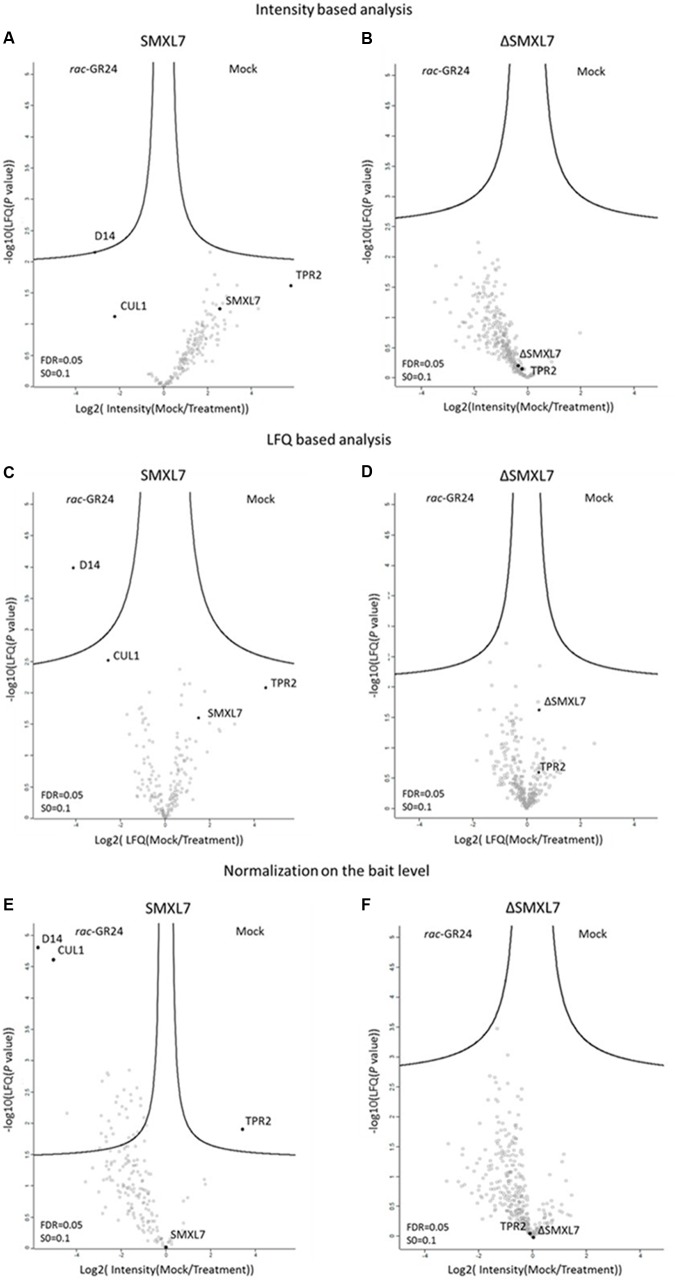
FIGURE 2.
Dynamics of SMXL7 and ΔSMXL7 protein complexes. Volcano plots showing the distribution of all quantified proteins after filtering and statistical analysis, with their corresponding protein abundance ratios (Mock/Treatment) over the t-test P-value (FDR = 0.05, S0 = 0.1). Analysis was based on intensity values (A,B,E,F) or on LFQ values (C,D). Protein distribution after normalization of the bait level (E,F).

