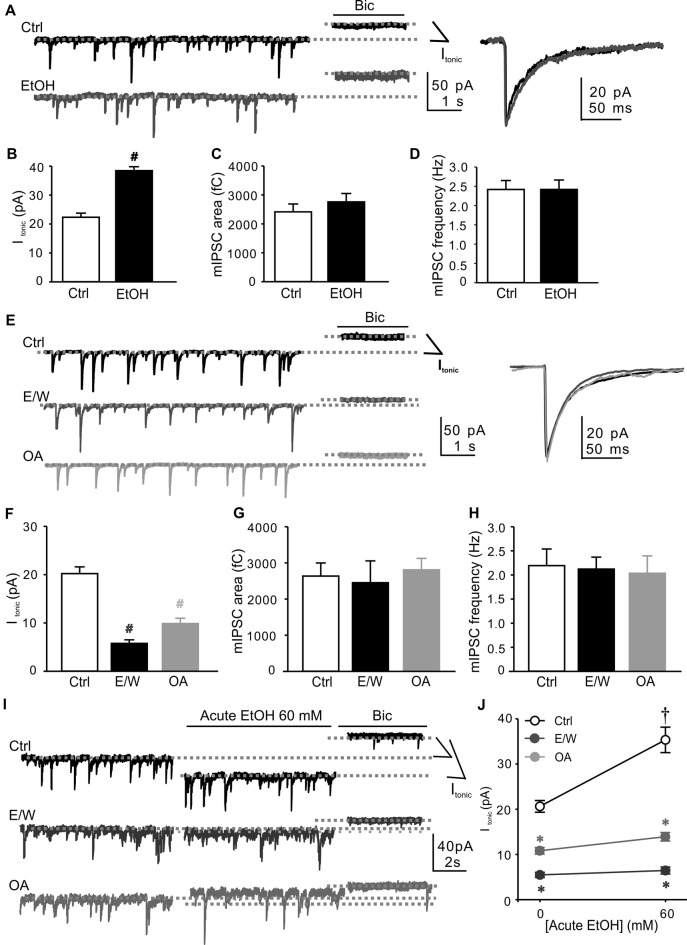
Figure 1.
Okadaic acid (OA) mimics a single ethanol (EtOH) withdrawal-induced decreases in extrasynaptic GABAAR-mediated tonic current (Itonic) and Itonic responsiveness to acute EtOH in cultured hippocampal neurons. Neurons were whole-cell voltage-clamped at −70 mV (holding potential, Ihold). (A) Left: sample traces of individual recordings from neurons during 30-min vehicle (Ctrl) or 60 mM EtOH exposure (EtOH). Right: averaged miniature inhibitory postsynaptic currents (mIPSCs). The Itonic amplitude is measured as currents at the experimental conditions vs. the mean current following bicuculline (Bic, 10 μM) application (dotted lines indicate Ihold: basal, light-gray line commencing at left margin; Bic application, and light-gray line commencing near far right end). (B–D) Changes in Itonic amplitude (B), total chargetransfer of mIPSCs (mIPSC area, C) and mIPSC frequency (D) recorded in neurons from Ctrl and EtOH groups as shown in (A). (E) Left: sample traces of individual recordings from neurons at 30 min after withdrawal from Ctrl and EtOH (60 mM for 30 min, E/W) as well as during 30-min OA (100 nM, OA) exposure. Right: averaged mIPSCs. (F–H) Changes in Itonic amplitude (F), mIPSC area (G) and frequency (H) recorded in neurons from Ctrl, E/W and OA groups as shown in (E). (I) Sample traces of individual recordings from Ctrl-, E/W- and OA-treated neurons. The Ihold after acute EtOH application is indicated by light-gray dotted lines (middle line commencing near far right end). (J) The effects of EtOH on Itonic amplitude from the same recordings as shown in (I). n = 10–13 per group. #p < 0.001 vs. Ctrl group (t test in B and one-way ANOVA with post hoc Dunnett’s test in F); †p < 0.001 vs. the pre-EtOH baseline value, *p < 0.001 vs. Ctrl group (two-way ANOVA with post hoc Holm-Sidak test).

