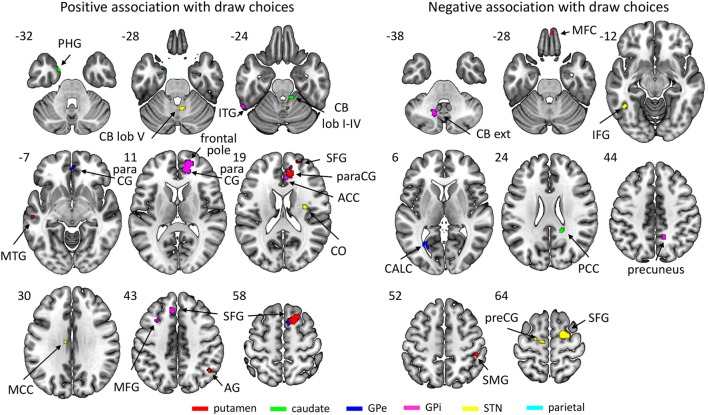
Figure 4.
Regions of which the connectivity strength with their respective region of interest was associated positively (left) or negatively (right) with the number of draw choices across participants. The key for the abbreviations can be found in the notes of Table 3.

