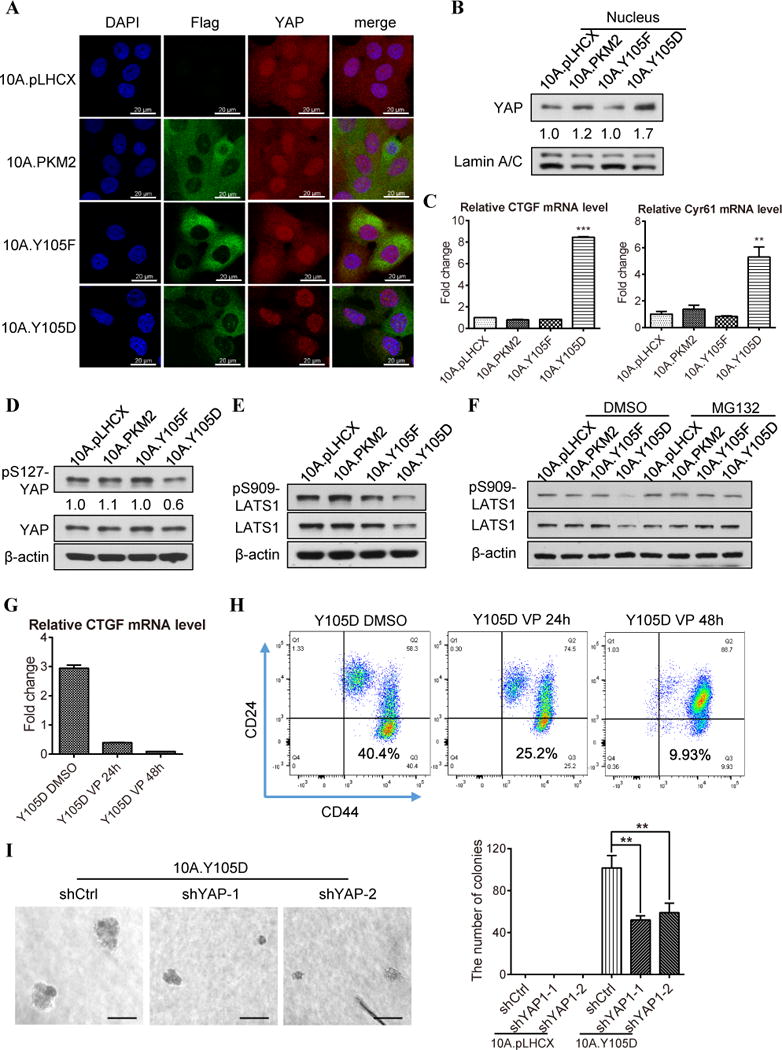
Figure 4. Phosphorylation of PKM2-Y105 induced cancer stem-like cell properties by activating YAP downstream signaling. A).

Immunofluorescence imaging of the expression and localization of exogenous PKM2 variants (indicated by Flag antibody, green), YAP (red) and the nucleus (DAPI, blue) in the 10A.pLHCX, 10A.PKM2, 10A.Y105F, and 10A.Y105D cells. B) Western blot analysis of the YAP protein levels in the nuclear fraction of the 10A.pLHCX, 10A.PKM2, 10A.Y105F, and 10A.Y105D cells. ImageJ software was used for quantification of YAP band intensity that was normalized to Lamin A/C. C) The CTGF and Cyr61 mRNA levels in the 10A.pLHCX, 10A.PKM2, 10A.Y105F, and 10A.Y105D cells were measured by quantitative PCR. “**” means P<0.01; “***” means P<0.001. D) Western blot analysis of pS127-YAP and total YAP protein levels in the 10A.pLHCX, 10A.PKM2, 10A.Y105F, and 10A.Y105D sublines. ImageJ software was used for quantification of each sublines’ pS127-YAP level (normalized to β-actin) compared to that in the 10A.pLHCX vector control cells. E) Western blot analysis of the pS909-LATS1 and total LATS1 levels in the 10A.pLHCX, 10A.PKM2, 10A.Y105F, and 10A.Y105D sublines. F) Western blot analysis of the pS909-LATS1 and total LATS1 levels in the MCF10A sublines treated with DMSO or 10 μM MG132 for 4 h. G) The CTGF mRNA level in 10A.Y105D cells treated with DMSO (as control, first bar), 10 μM Verteporfin, for 24h or 48h. H) Flow cytometry analysis of the cancer stem-like cell population (CD44hi/CD24neg) in 10A.Y105D cells treated as in G. I) Representative images (left) and quantification (right) of the soft agar colonies from 10A.Y105D cells transfected with control shRNA (shCtrl) or two different YAP shRNAs (shYAP-1, and shYAP-2). “**” means P<0.01.
