
Figure 1.
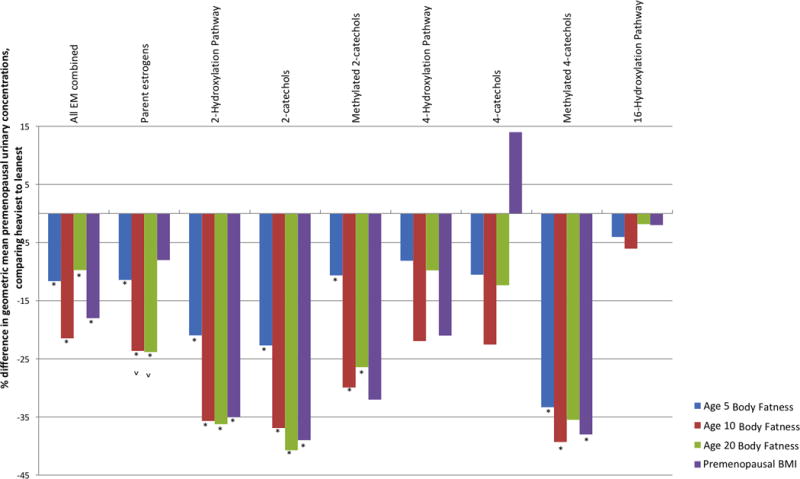
Relative difference in premenopausal estrogen metabolism pathways, comparing the heaviest to leanest based on recalled body fatness at ages 5, 10 and 20 and BMI in the premenopausal years. Geometric means for urinary concentrations of each metabolic pathway for the heaviest (pictograms 5+ or 30+ kg/m2) and leanest women (pictogram 1 or <22 kg/m2) were calculated using linear mixed models, adjusted for age at urine collection, ovulatory cycle, luteal phase of sample, first morning urine sample, age at first birth/parity, physical activity, alcohol intake, caffeine intake, current smoker, current menstrual cycle length, and current menstrual cycle regularity. Tests for trend were conducted by modeling the body fatness categories as a continuous exposure and calculating the Wald statistic. The estrogen metabolism pathways with statistically significant trends are marked with an asterisk (*). Trends that remained significant after addition of adult premenopausal BMI to the model are marked by a caret (ˆ)