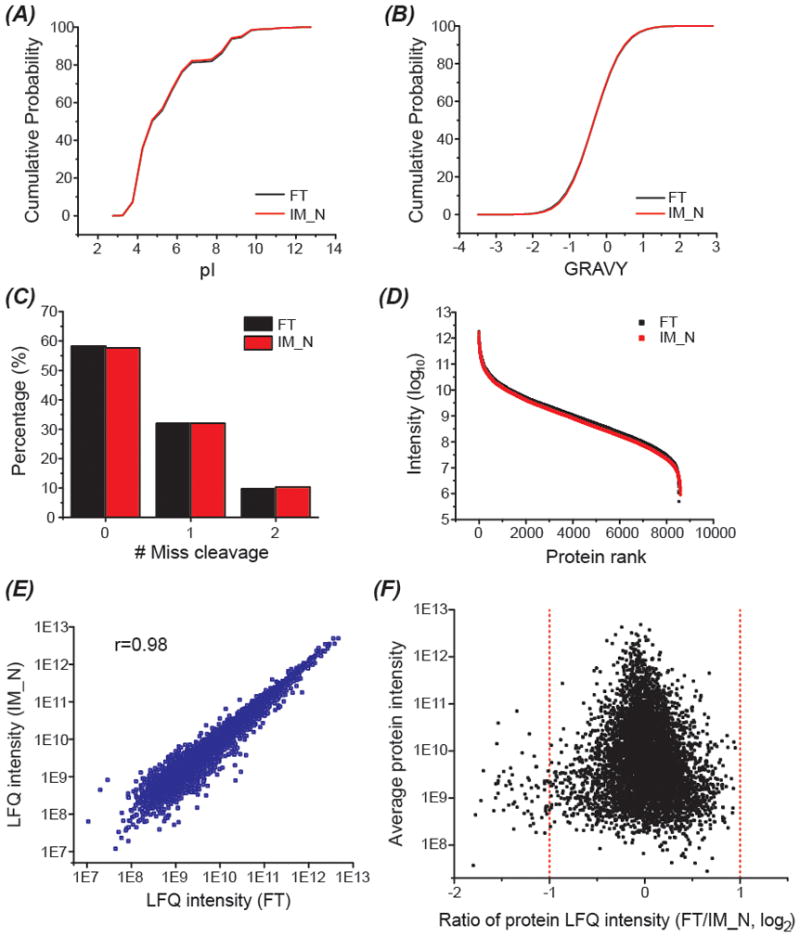
Figure 3.

Data analysis of identified peptides and protein groups from the mouse brain proteome sample digested by FT and IM-N after analyzed by 2D-LC-MS/MS. (A) Cumulative distribution of the peptide pIs. (B) Cumulative distribution of the GRAVY values of peptides. (C) Distributions of the missed cleavages on peptides. (D) Dynamic range of observed proteome using FT and IM-N. (E) Log-log correlation of protein LFQ intensity between FT and IM-N. (F) Comparison of the protein LFQ intensity from FT and IM-N. The average LFQ intensity of each protein from FT and IM-N vs. the ratio of protein LFQ intensity between FT and IM-N (Log2).
