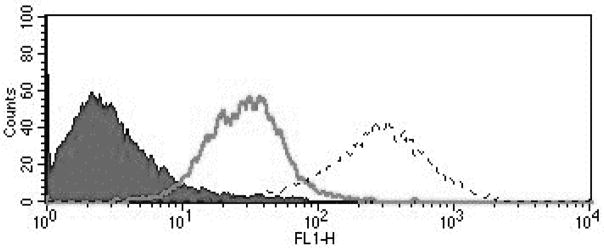
FIGURE 2.
Flow cytometry histograms of primary uterine cancer cell lines showing 0 (END(K)153, black), 1+ (END(K)34, solid gray line), 2+ (END(K)265, dashed line) folic acid alpha receptor (FRα) expression. FRα 1+ and 2+ show significantly higher mean fluorescence intensity versus the 0 FRα expression cell lines.

