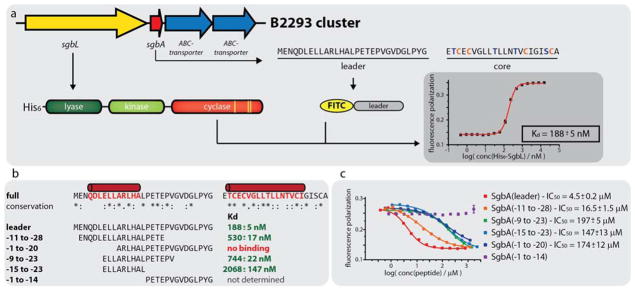
Figure 5.
(a) Schematic showing the principle of the fluorescence polarization (FP) binding studies. The representative graph was recorded at 100 nM FITC-SgbA(leader) and varying concentrations of His6-SgbL. (b) Overview of the results of the FP binding studies with the different N-terminally FITC-labeled leader peptide truncants. Predicted α-helical regions in the precursor peptide are shown in red. The corresponding graphs are depicted in Supporting Information Figures S7 and S8 (c) Overview of the results of the FP competition assays using 100 nM FITC-SgbA(leader), 240 nM His6-SgbL and varying concentrations of the respective competitor peptide.

