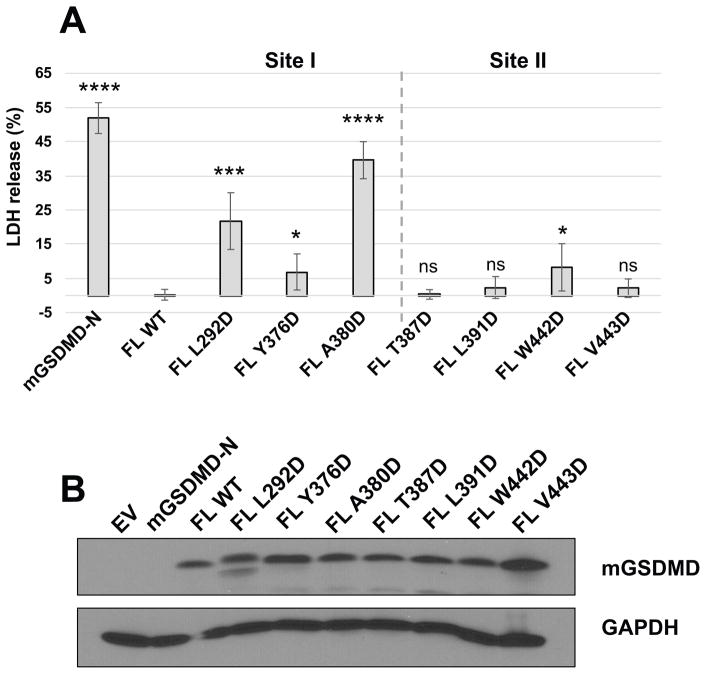
Figure 3. Mutations at the N-/C- Domain Interface Impact Pyroptosis.
The WT or mutant mGSDMD was expressed in HEK293T cells. The LDH release induced by the expressed mGSDMD as percentage of total LDH content after Triton X-100 treatment is shown in (A). The gray dotted lines delineate mutations for site I (left) and site II (right). The average ± SD is shown for three independent experiments. Statistical analysis is calculated by two-tailed t-test, compared to the “FL WT” samples. *P < 0.05, **P < 0.01, ***P < 0.001, ****P < 0.0001. Expression levels for the WT and mutant mGSDMD as well as GAPDH are shown in (B).
See also Data S1.

