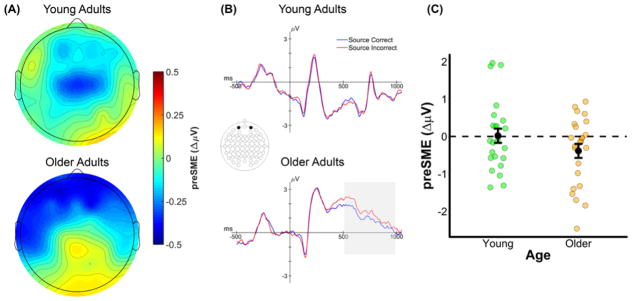
Figure 4.
(A) Scalp plot of the preSMEs (source correct – source incorrect) in young and older adults in the 500–1000 ms time window following onset of the task cue (collapsed across encoding condition). Note the common scale used to depict the magnitude of the preSMEs in each age group. (B) ERP grand average traces from a virtual electrode created by averaging across electrodes Fp1 and Fp2. The ERP trace only plots the first 1000 ms the task cue epoch to highlight this early effect. (C) Plot showing the group means (black points) and individual preSMEs (green and orange points) for young and older adults. Data were average across electrodes Fp1 and Fp2 in the 500 to 1000 ms time window. Error bars reflect ±1 standard error of the mean.

