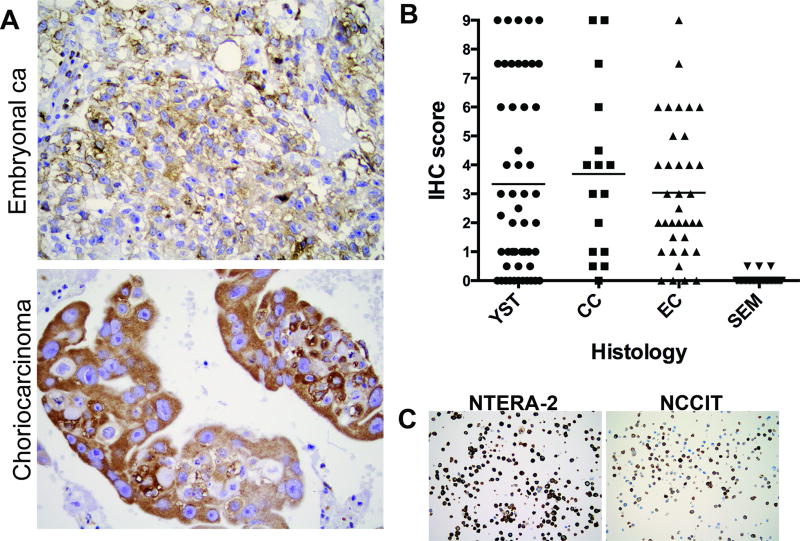
Figure 2. Other nonseminomatous GCT histologies also exhibit highly active mTORC1 signaling.
A, IHC staining for phosphorylated S6 in embryonal carcinoma (top) and choriocarcinoma (bottom). B, phospho-S6 IHC intensity score in GCT histologies. Horizontal bar represents mean values for each histology. YST: yolk sac tumor; CC: Choriocarcinoma; EC: Embryonal Carcinoma; SEM: Seminoma. p-values for comparison with SEM: YST <0.001; CC 0.0002; EC <0.0001 (2–tailed Student’s t-test). C, IHC for phosphorylated S6 in NCCIT and NTERA-2 cells.

