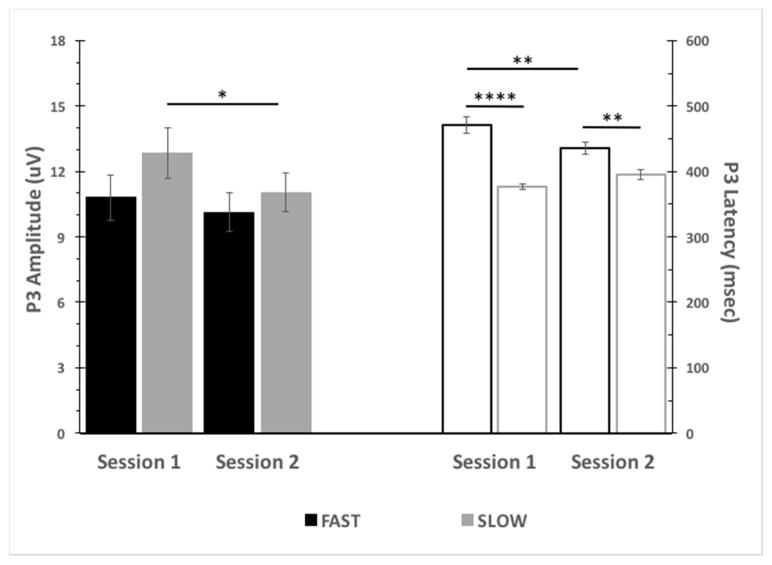
Fig. 4.
Baseline P3 Amplitude and Latency by Session and SSD group. P3 Amplitude (Left, Closed Bars): No baseline P3 amplitude differences between FAST and SLOW SSD groups was observed across sessions. SLOW SSD group baseline P3 amplitude was significantly reduced in Session 2 versus Session 1. P3 Latency (Right, Open Bars): FAST SSD group baseline P3 latency was significantly longer than that of SLOW SSD group across sessions. FAST SSD group baseline P3 latency was significantly reduced in Session 2 versus Session 1. (* p<0.05; **p<0.01; ****p<0.0001).

