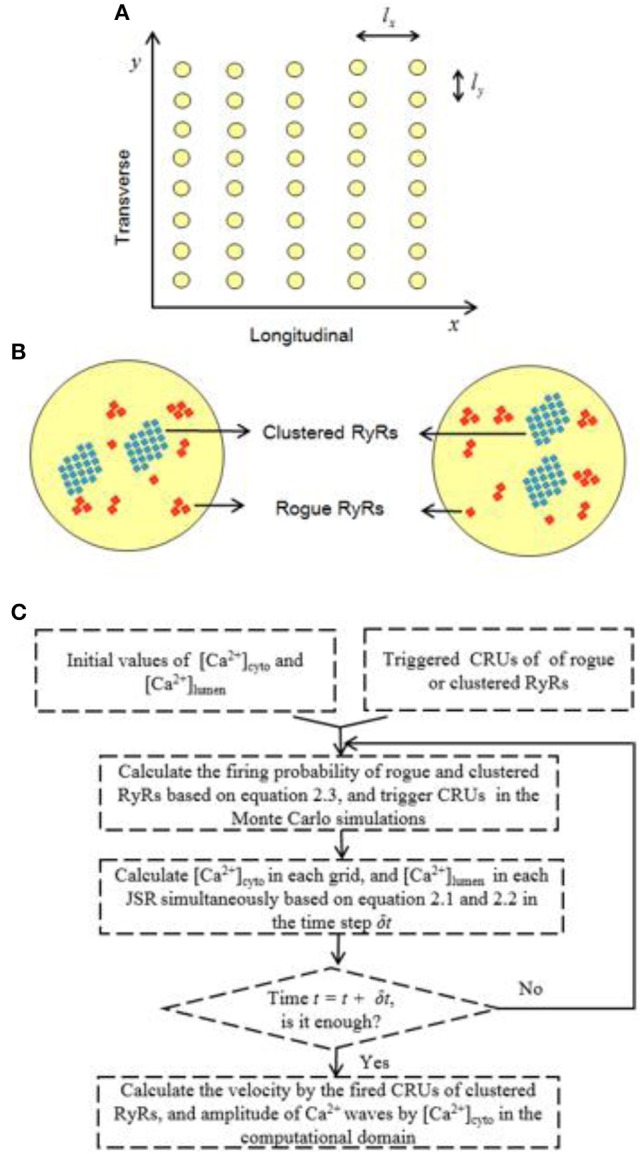
Figure 1.

Schematic illustration of the 2D model for Ca2+ waves. (A) Schematic representative of the 2D geometrical model of a cardiac myocyte. The yellow circles denote JSRs. The spacing intervals between JSRs: lx = 2 μm and ly = 0.8 μm. (B) Schematic representative of two JSRs, which include randomly distributed clustered and rogue RyRs (l = 0.1 μm). (C) A flow diagram for the Monte Carlo simulations.
