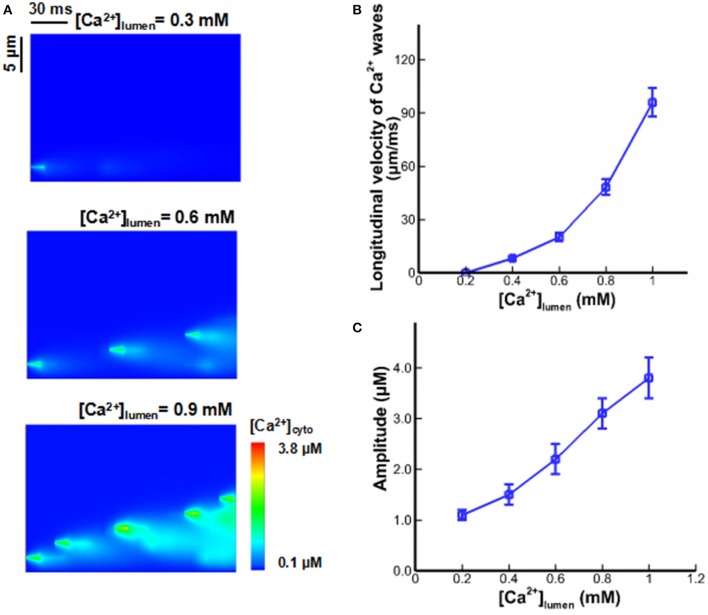
Figure 5.
Ca2+ waves under different [Ca2+]lumen. (A) Computational results for line-scan images of [Ca2+]cyto at the line of y = 16.8 when [Ca2+]lumen = 0.3, 0.6, and 0.9 mM. (B) The longitudinal velocity of Ca2+ waves affected by [Ca2+]lumen. (C) The amplitude of Ca2+ waves affected by [Ca2+]lumen.

